Skip to content

Ecce Signum

Immanentize the Empathy

  • Home
  • About Me
  • Published Works and Literary Matters
  • Indexes
  • Laboratory
  • Notebooks
  • RSS Feed

Month: January 2012

HTML5 Canvas Drawing Library Exploration: oCanvas.js

2012-01-29 John Winkelman

This is part 2 of an ongoing series exploring the different Javascript/canvas element drawing libraries which are currently in use.

oCanvas.js is another small-footprint, easy to use Javascript library. In use it is similar to Easel.js (see my review of easel.js here), but the syntax is a little simpler. Where Easel feels more like Actionscript, oCanvas feels more like jQuery. This makes sense, since Easel was written to appeal to Flash developers.

Other than syntax, oCanvas and Easel seem to be interchangeable. Easel might have more fine-tuned control over drawing, but not enough to make a significant difference in any but the most complex web applications.

oCanvas is a lot of fun to play with, The syntax is easy to pick up; the documentation is well structured, and anyone familiar with jQuery should be able to extrapolate from the examples on the oCanvas site and have something up and running in a few minutes.

The only real downside to oCanvas is that no-one appears to be using it. Almost all of the articles I found which talk about oCanvas are of the “here are a dozen new Javascript drawing libraries” type, and they only link back to the oCanvas page. No examples out in the wild. No demos or source code other than that created by the oCanvas team. I think that is a shame. oCanvas deserves more attention than that.

So here is a simple demonstration of oCanvas, along with source code and commentary. Enjoy!

Click to Launch the demo.

HTML

<!DOCTYPE html>
<html>
	<head>
		<title>oCanvas.js demo</title>
		<style>
			* {margin:0;padding:0;}
			body {background:#ffffff;margin:0;padding:0;overflow:hidden;}
			#myCanvas {position:absolute;left:0;top:0;width:800px;height:480px;background:#ffffff;}
		</style>
		<script type="text/javascript" src="ocanvas.js"></script>
		<script type="text/javascript" src="ocanvas-test-code.js"></script>
	</head>
	<body>
		<canvas id="myCanvas" width="800" height="480"></canvas>
	</body>
</html>

Nothing too exciting in the HTML. Be sure to include the width and height attributes in the canvas element so that the graphics therein are not distorted.

Javascript

/*	global variables	*/
var canvas,
	currentShape="circle",
	isPaused = true,
	isInitialized = false;

/*	math and positioning	*/
var shapes = ["circle","tricuspoid","tetracuspoid","epicycloid","epicycloid 2","epicycloid 3","lissajous","lemniscate","butterfly"];
var w = 800;
var h = 480;
var centerX = 240;
var centerY = 240;
var radius_x = 150;
var radius_y = 150;
var theta = 0;
var objects = [];
var numObjects = 0;
var r2d = 180/Math.PI;
var d2r = Math.PI/180;
var orbitSteps = 180;
var orbitSpeed = Math.PI*2/orbitSteps;
var objectInterval;
var objectPosition;
var direction = 1;
var index = 0;
var xVar1 = 0;
var xVar2;
var xVar3;
var xVar4;
var startingObjects = 100;
var newX;
var newY;

onload = init;

function init() {
	canvas = oCanvas.create({
		canvas: "#myCanvas",
		background: "#ffffff"
	});
	
	initInterface();
	initObjects();
	
	
	onEnterFrame();
	isInitialized = true;
	canvas.setLoop(onEnterFrame).start();
}

function initInterface() {
	var xOff = 625;
	var yOff = 25;
	for(var i=0;i<shapes.length;i++) {
		var b = canvas.display.rectangle({
			x:xOff,
			y:yOff,
			width:150,
			height:20,
			fill:'#ededed',
			stroke:'1px outside #808080',
			shapeName:shapes[i]
		});
		var txt = canvas.display.text({
			x:75,
			y:4,
			align:'center',
			font:'12px courier,monospace',
			text:shapes[i],
			fill:'#000000'
		});
		b.addChild(txt);
		b.bind('mouseenter',function(){
			document.getElementById("myCanvas").style.cursor="pointer";
			this.fill = '#ffffff';
		});
		b.bind('mouseleave',function(){
			document.getElementById("myCanvas").style.cursor="auto";
			this.fill = '#ededed';
		});
		b.bind('click',function(){
			currentShape = this.shapeName;
			isInitialized = false;
			onEnterFrame();
			isInitialized = true;
		});
		yOff += 23;
		canvas.addChild(b);
	}
	yOff += 23;
	var pauseButton = canvas.display.rectangle({
		x:xOff,
		y:yOff,
		width:150,
		height:20,
		fill:'#ededed',
		stroke:'1px outside #808080'
	});
	var pauseButtonText = canvas.display.text({
		x:75,
		y:4,
		align:'center',
		font:'12px courier,monospace',
		text:"PLAY/PAUSE",
		fill:'#000000'
	});
	pauseButton.addChild(pauseButtonText);
	pauseButton.bind('mouseenter',function(){
		document.getElementById("myCanvas").style.cursor="pointer";
		this.fill = '#ffffff';
	});
	pauseButton.bind('mouseleave',function(){
		document.getElementById("myCanvas").style.cursor="auto";
		this.fill = '#ededed';
	});
	pauseButton.bind('click',function() {
		isPaused = !isPaused;
	});
	canvas.addChild(pauseButton);

}
function initObjects() {
	for(var i=0;i<startingObjects;i++) {
		addObject();
	}
}
function addObject() {
var obj = canvas.display.ellipse({
		x:centerX,
		y:centerY,
		radius_x:5,
		radius_y:5,
		stroke:"1px #000000",
		fill:"#"+randomRGB()+randomRGB()+randomRGB()
	});
	objects.push(obj);
	numObjects = objects.length;
	objectInterval = orbitSteps/numObjects;
	canvas.addChild(obj);
}
function removeObject() {
	numObjects = objects.length;
	objectInterval = orbitSteps/numObjects;
}

function randomRGB(){
	var s = Math.floor(Math.random()*256).toString(16);
	if(s.length==1) s = "0"+s;
	return s;
}
function onEnterFrame() {
	if(isPaused==true && isInitialized==true) return;
	for(var i = 0; i < numObjects; i++) {
		objectPosition = orbitSpeed*objectInterval*i;    //    each object is individually updated
		switch(currentShape) {
			case "circle":
				newX = centerX + radius_x * Math.cos(theta + objectPosition);
				newY = centerY + radius_y * Math.sin(theta + objectPosition);
				break;
			case "tricuspoid":
				newX = centerX + (radius_x*.5) * ((2 * Math.cos(theta + objectPosition)) + Math.cos(2 * (theta + objectPosition)));
				newY = centerY + (radius_y*.5) * ((2 * Math.sin(theta + objectPosition)) - Math.sin(2 * (theta + objectPosition)));
				break;
			case "tetracuspoid":
				newX = centerX + radius_x * Math.pow((Math.cos(theta + objectPosition)),3);
				newY = centerY + radius_y * Math.pow((Math.sin(theta + objectPosition)),3);
				break;
			case "epicycloid":
				newX = centerX + (radius_x*.4) * Math.cos(theta + objectPosition) - radius_x*1*(Math.cos((radius_x/radius_x + 1) * (theta + objectPosition)));
				newY = centerY + (radius_y*.4) * Math.sin(theta + objectPosition) - radius_y*1*(Math.sin((radius_y/radius_y + 1) * (theta + objectPosition)));
				break;
			case "epicycloid 2":
				newX = centerX + (radius_x*.4) * Math.cos(theta + objectPosition) - radius_x*1*(Math.cos((radius_x/radius_x + 2) * (theta + objectPosition)));
				newY = centerY + (radius_y*.4) * Math.sin(theta + objectPosition) - radius_y*1*(Math.sin((radius_y/radius_y + 2) * (theta + objectPosition)));
				break;
			case "epicycloid 3":
				newX = centerX + (radius_x*.4) * Math.cos(theta + objectPosition) - radius_x*1*(Math.cos((radius_x/radius_x + 3) * (theta + objectPosition)));
				newY = centerY + (radius_y*.4) * Math.sin(theta + objectPosition) - radius_y*1*(Math.sin((radius_y/radius_y + 3) * (theta + objectPosition)));
				break;
			case "lissajous":
				newX = centerX + radius_x * (Math.sin(3 * (theta + objectPosition) + xVar1));
				newY = centerY + radius_y * Math.sin(theta + objectPosition);
				xVar1 += .002;
				break;
			case "lemniscate":
				newX = centerX + (radius_x*1.2) * ((Math.cos(theta + objectPosition)/(1 + Math.pow(Math.sin(theta + objectPosition),2))));
				newY = centerY + (radius_y*1.2) * (Math.sin(theta + objectPosition) * (Math.cos(theta + objectPosition)/(1 + Math.pow(Math.sin(theta + objectPosition),2))));
				break;
			case "butterfly":
				newX = centerX + (radius_x*.4) * (Math.cos(theta + objectPosition) * (Math.pow(5,Math.cos(theta+objectPosition)) - 2 * Math.cos(4 * (theta+objectPosition)) - Math.pow(Math.sin((theta+objectPosition)/12),4)));
				newY = centerY + (radius_y*.4) * (Math.sin(theta + objectPosition) * (Math.pow(5,Math.cos(theta+objectPosition)) - 2 * Math.cos(4 * (theta+objectPosition)) - Math.pow(Math.sin((theta+objectPosition)/12),4)));
				break;
			default:
				break;
	
		}
		objects[i].x = newX;
		objects[i].y = newY;
	}
	theta += (orbitSpeed*direction);
}

Here is a line-by-line breakdown of the preceding Javascript:

  • 2-5
    • initializing global variables
  • 8-32
    • initializing variables for the demo. This is mostly all for the animation. Nothing here that is oCanvas-specific.
  • 34
    • This tells the browser to fire the init() function when the page finishes loading.
  • 36-49 – function init()
    • Fired when the page loads
      • 37-40 initialize the global canvas variable, and associate it with the HTML canvas element which has the id of “myCanvcas”
      • 42-43 – create the user interface, and initialize the objects for animation
      • 46 – call the animation function once in order to display the objects
      • 47 – set the global initialization state
      • 48 – begin the animation. By default the animation is paused
  • 51-121 – initInterface()
    • Create the user interface for the demo
      • 52-53 – set the base position for the UI buttons
      • 54-89 – create the UI buttons
        • 55-63 – create and style a rectangle graphic, and assign the “shapeName” property, which references one of the animation sequences
        • 64-71 – create and style a text block, which displays the name of one of the animation sequences
        • 72 – add the text block as a child of the rectangle graphic
        • 73-76 – add the mouseover behavior for the button
        • 77-80 – and the mouseout behavior for the button
        • 81-86 – add the onclick behavior to the button. Updates the “currentShape”  variable to equal the value of the button’s “shapeName” property
        • 87 – update the base Y position for the buttons
        • 88 – add the button object to the canvas object. This is how objects are made visible in oCanvas
      • 90 – update the Y variable to add some space between the preceding buttons and the play/pause button
      • 91-98 – create and style a rectangle graphic for the play/pause button
      • 99-106 – create a text block for the play/pause button
      • 107 – add the text block as a child of the play/pause button graphic
      • 108-111 – add mouseover functionality to the play/pause button
      • 112-115 – add mouseout functionality to the play/pause button
      • 116-118 – add onclick functionality to the play/pause button. A click will toggle the paused state of the demo
      • 119 – add the play/pause button to the canvas
  • 122-126 – initObjects()
    • This method counts up to the value of startingObjects and calls addObject once for each iteration
  • 127-140 – addObject()
    • this function creates a circle graphic, styles it, updates some of the animation variables, and adds the new object to the canvas
      • 128-135 – create and style a circle graphic
      • 136 – add the circle to the array of circles
      • 137 – update the numObjects variable to equal the number of elements in the objects array
      • 138 – update the spacing between circles, based on the number of circles in the animation
      • 139 – add the new circle graphic to the canvas
  • 141-144 – removeObject()
    • remove a circle from the animation. Not used in this demo
  • 146-150 – randomRGB()
    • create a random hexadecimal number between 0 and 255, convert it to a string, and return it for use in coloring the circle graphics.
  • 151-201 – onEnterFrame()
    • This is the function which animates the circles based on the current animation pattern, which is held in the variable “currentShape”
      • 152 – if the animation is currently paused, do nothing
      • 153 – begin iterating through each object in the animation
      • 154 – get the position of the circle in the sequence of circles
      • 155-196 – based on the variable “currentShape”, determine the new position of the circle within the animation
      • 197-198 – update the position of the circle within the canvas
      • 200 – increment the rotation of the entire animation

And there you have it. If you compare the code for this animation with the code in the Easel.js post, you will see that they are quite similar. The syntax for oCanvas is a little simpler, but it still allows the same control over style and position.

As in the other articles in this series, the math for the animations comes from my Simple Trigonometric Curves Tutorial over at Kongregate.

I hope that oCanvas gets some more attention from web developers. It is a worthy project.
 

Posted in ProgrammingTagged math, procedural art comment on HTML5 Canvas Drawing Library Exploration: oCanvas.js

Serving Up Static HTML Pages in Drupal Gardens Websites

2012-01-27 John Winkelman

As the learning curve for out-of-the-box content management systems flattens out, hand-coded HTML pages are becoming something of a rare bird. With services like Facebook, WordPress, Tumblr, and a hundred others, there simply isn’t as much call for hand-coded, one-off web sites. However, they still have their place – either in sites like this one, where I like posting experiments in a variety of languages, or for more professional organizations, where HTML wireframes or interactive comps would be more useful than static Photoshop documents and Powerpoint presentations.

Therefore, I took it upon myself to figure out how to serve up individual, custom HTML pages from within the confines of this site, which is a custom installation of Drupal 7, hosted at Drupal Gardens, and served up as cloud-based Software-as-a Service.

It is quite simple, actually. First, you need to have a static HTML page, which either contains within it everything you need, or has links to the appropriate outside assets. These could be images, external stylesheets, Flash movies, or the like. So if you have something like this:

<!DOCTYPE html>
<html>
	<head>
		<title>Static HTML Page Demo</title>
		<style>
			* {margin:0;padding:0;}
			body {background:#ffffff;}
			p {font:12px/18px arial,sans-serif;color:#333333;}
		</style>
		<script type="text/javascript" src="/sites/mysite.drupalgardens.com/files/my-groovy-code.js"></script>
	</head>
	<body>
		<p>Welcome to my wonderful website</p>
	</body>
</html>

…in a file called, say, “static-html-page-example.html”. Then, in order to put it in a place where it is accessible to the world, you can do the following:

  1. Log into your Drupal Gardens website
  2. Click on “Configuration”
  3. In the “Media” box of the configuration page, click on “Media browser settings”
  4. In the “Allowed file extensions” text area, add html to the end. Be sure to use a space to separate it from the other extensions.
  5. Click “Save configuration”.
  6. In the upper bar of the content area, click on “content”
  7. When the main content page opens, click on the “MEDIA” tab on the right side of the page
  8. In the new screen, click “+ Add File”
  9. drag your HTML file onto the “add file” area (or browse to it and click “add”), then click “Start Upload”
  10. You will now see your file appear in the list of media assets for your library. Click on it.
  11. You should now see a page, the content of which is a link to your static HTML page. If you click that link, it will take you to that page. Click here to see how it works.

See? That was easy! Once you have your assets created, all you need to do is organize and upload.

You will only need to performs steps 1-5 once. After you add a file extension, it is there for good.

Since Drupal Gardens has constraints over and above a normal Drupal install, some allowances must be made. Here are a few things to watch out for:

  • Every external asset in your static  page – images, videos, Flash files, style sheets, etc., must also be uploaded to the Drupal Gardens media directory. The same process you used to serve up your static HTML file also applies for these assets. You shouldn’t need to add file extensions for images or videos, but you might for Flash (swf), and you will for Javascript (js) and style sheets (css).
  • Since every asset is served from the files directory, you need to make sure you acount for this when you create the HTML page. The path to all of you assets will be
    “/sites/mysite.drupalgardens.com/files/myAsset.css”. Be sure to add the leading slash.

    • Alternately, you could add a <base href=”/sites/mysite.drupalgardens.com/files/”/> element in the <head/> element of your static HTML file (information here). This would cut down on the amount of modification you would need to do when moving the static site from your computer to Drupal Gardens. You could simple add the tag to all of your HTML files right before you upload everything.
  • Again, since all uploaded media, files, assets, etc. for your entire Drupal Gardens site are stored in a single directory, it is important to name all of your assets in such a way that it is easy to determine which asset goes with which project. I have found that using a prefix is a great way to keep things organized. Here are a couple of examples:
    • “20120126-index.html”
    • “20120126-image-0.jpg”
    • “20120126-stylesheet.css”
    • “clientname-index.html”
    • “date-client-file-1.html”

There! The best of both worlds: A managed Drupal environment, and the ability to upload and serve custom, static HTML pages if and as the need arises.

Posted in Programming comment on Serving Up Static HTML Pages in Drupal Gardens Websites

HTML5 Canvas Drawing Library Exploration: Easel.js

2012-01-26 John Winkelman

I’ve spent the last few weeks, at home and at work, exploring some of the capabilities of HTML 5. The most exciting one for me, at the moment, is the Canvas element, which allows dynamic creation and updating of graphics within a web page. This type of functionality is useful for creating games, data visualizations, custom user interfaces, and most anything else that traditionally is considered to be in the realm of Adobe Flash.

In exploring the various tutorials I discovered that many people have put a lot of time into building Javascript libraries which add functionality to the canvas tag, making it more Flash-like. A side effect of this is that these libraries usually – though not always – simplify the coding process dramatically. What could take many hours and many hundreds of lines of custom code can now be accomplished in a short amount of time and relatively little code.

So starting with this post, and going on for the next few weeks, I will be posting examples of these libraries in use, along with source code and commentary. A note here: The examples will only work in browsers which support the canvas tag – Internet Explorer 9+, Firefox, Safari or Chrome on Windows, and Safari and Chrome on Macs, and Chrome and Konqueror on Linux. These examples should also work on most newer mobile devices using their default web browsers. However, things might be a little slow and clunky.

For this post, I am working with Easel.js (current version 0.4), a canvas drawing library created by Flash guru Grant Skinner.

When I learn a new language or technology, I consider the first sign of success to be when I manage to get a bunch of objects to spin in a circle. The canvas tag libraries are no different. For this, and the next several, I have re-created the Trigonometron (which seems to have not made the transition to the new site…), one of my proudest moments as a Flash developer.

Click to launch the demo.

Detailed breakdown of the code follows:

HTML

<!DOCTYPE html>
<html>
	<head>
		<title>Easel.js demo</title>
		<style>
			* {margin:0;padding:0;}
			body {background:#ffffff;margin:0;padding:0;overflow:hidden;}
			#myCanvas {position:absolute;left:0;top:0;width:800px;height:480px;background:#ffffff;}
		</style>
		<script type="text/javascript" src="easel.js"></script>
		<script type="text/javascript" src="easel-demo-code.js"></script>
	</head>
	<body>
		<canvas id="myCanvas" width="800" height="480"></canvas>
	</body>
</html>

Nothing particularly amazing about this HTML. Note that I used the width and height attributes in the canvas tag, rather than simply relying on the style sheet. This is a quirk of Easel.js – if the width and height attributes are not set, then it will visibly skew and stretch the graphics inside the canvas tag. Hopefully this will be addressed in an upcoming release.

Javascript

/*	global variables	*/
var canvas,
	stage,
	currentShape="circle",
	isPaused = true,
	isInitialized = false;

/*	math and positioning	*/
var shapes = ["circle","tricuspoid","tetracuspoid","epicycloid","epicycloid 2","epicycloid 3","lissajous","lemniscate","butterfly"];
var w = 800;
var h = 480;
var centerX = 240;
var centerY = 240;
var radius_x = 150;
var radius_y = 150;
var theta = 0;
var objects = [];
var numObjects = 0;
var r2d = 180/Math.PI;
var d2r = Math.PI/180;
var orbitSteps = 180;
var orbitSpeed = Math.PI*2/orbitSteps;
var objectInterval;// = orbitSteps/numObjects;
var objectPosition;
var direction = 1;
var index = 0;
var xVar1 = 0;
var xVar2;
var xVar3;
var xVar4;
var startingObjects = 100;
var newX;
var newY;

onload = initEaselDemo;

function initEaselDemo() {
	canvas = document.getElementById("myCanvas");
	stage = new Stage(canvas);
	stage.enableMouseOver(36)
	stage.mouseEnabled = true;
	
	initInterface();
	initObjects();
	
	//	set 
	Ticker.setFPS(36);
	Ticker.addListener(window);
	tick();
	isInitialized = true;
}

function initInterface() {
	var interfaceBase = new Container();
	interfaceBase.x = 630;
	interfaceBase.y = 20;
	for(var i=0;i<shapes.length;i++) {
		var b = new Container();
		b.mouseEnabled = true;
		b.shape = shapes[i];
		var g = new Graphics();
		g.setStrokeStyle(1)
			.beginStroke('#808080')
			.beginFill('#ededed')
			.rect(0,0,150,20);
		var s = new Shape(g);
		s.x = 0;
		s.y = 0;
		
		var t = new Text(shapes[i],"12px Courier","#000000");
		t.textAlign="center";
		t.x = 75;
		t.y = 14;
		
		b.addChild(s);
		b.addChild(t);
		b.x = 0;
		b.y = i*23;
		b.onMouseOver = function(e) {
			document.getElementById("myCanvas").style.cursor="pointer";
			e.target.getChildAt(0).graphics.beginFill("#ffffff").rect(0,0,150,20);
			if(isPaused) stage.update();
		}
		b.onMouseOut = function(e) {
			document.getElementById("myCanvas").style.cursor="auto";
			e.target.getChildAt(0).graphics.beginFill("#ededed").rect(0,0,150,20);
			if(isPaused) stage.update();
		}
		b.onClick = function(e) {
			currentShape = e.target.shape;
			isInitialized = false;
			tick();
			isInitialized = true;
		}
		
		interfaceBase.addChild(b);


	}
	var ppb = new Container();
	ppb.x = 0;
	ppb.y = (shapes.length*23+10);
	var ppg = new Graphics()
		.setStrokeStyle(1)
		.beginStroke('#808080')
		.beginFill('#ededed')
		.rect(0,0,150,20);
	var pps = new Shape(ppg);
	pps.x = 0;
	pps.y = 0;
	var ppt = new Text("PLAY/PAUSE","12px Arial,sans-serif","#000000");
	ppt.textAlign = "center";
	ppt.x = 75;
	ppt.y = 14;
	ppb.addChild(pps);
	ppb.addChild(ppt);
	ppb.onMouseOver = function(e){
		document.getElementById("myCanvas").style.cursor="pointer";
		e.target.getChildAt(0).graphics.beginFill("#ffffff").rect(0,0,150,20);
		stage.update();
	}
	ppb.onMouseOut = function(e){
		document.getElementById("myCanvas").style.cursor="auto";
		e.target.getChildAt(0).graphics.beginFill("#ededed").rect(0,0,150,20);
		stage.update();
	}
	ppb.onClick = function() {
		isPaused = !isPaused;
	}
	interfaceBase.addChild(ppb);
	
	stage.addChild(interfaceBase);
}
function initObjects() {
	for(var i=0;i<startingObjects;i++) {
		addObject();
	}
}
function addObject() {
	var g = new Graphics()
		.setStrokeStyle(1)
		.beginStroke("#000000")
		.beginFill("#"+randomRGB()+randomRGB()+randomRGB())
		.drawCircle(0,0,5)
		.endFill();
	var s = new Shape(g);
	s.x = centerX;
	s.y = centerY;
	objects.push(s);
	numObjects = objects.length;
	objectInterval = orbitSteps/numObjects;
	stage.addChild(s);
}
function removeObject() {
	numObjects = objects.length;
	objectInterval = orbitSteps/numObjects;
}

function randomRGB(){
	var s = Math.floor(Math.random()*256).toString(16);
	if(s.length==1) s = "0"+s;
	return s;
}
function tick() {
	if(isPaused==true && isInitialized==true) return;
	for(var i = 0; i < numObjects; i++) {
		objectPosition = orbitSpeed*objectInterval*i;    //    each object is individually updated
		switch(currentShape) {
			case "circle":
				newX = centerX + radius_x * Math.cos(theta + objectPosition);
				newY = centerY + radius_y * Math.sin(theta + objectPosition);
				break;
			case "tricuspoid":
				newX = centerX + (radius_x*.5) * ((2 * Math.cos(theta + objectPosition)) + Math.cos(2 * (theta + objectPosition)));
				newY = centerY + (radius_y*.5) * ((2 * Math.sin(theta + objectPosition)) - Math.sin(2 * (theta + objectPosition)));
				break;
			case "tetracuspoid":
				newX = centerX + radius_x * Math.pow((Math.cos(theta + objectPosition)),3);
				newY = centerY + radius_y * Math.pow((Math.sin(theta + objectPosition)),3);
				break;
			case "epicycloid":
				newX = centerX + (radius_x*.4) * Math.cos(theta + objectPosition) - radius_x*1*(Math.cos((radius_x/radius_x + 1) * (theta + objectPosition)));
				newY = centerY + (radius_y*.4) * Math.sin(theta + objectPosition) - radius_y*1*(Math.sin((radius_y/radius_y + 1) * (theta + objectPosition)));
				break;
			case "epicycloid 2":
				newX = centerX + (radius_x*.4) * Math.cos(theta + objectPosition) - radius_x*1*(Math.cos((radius_x/radius_x + 2) * (theta + objectPosition)));
				newY = centerY + (radius_y*.4) * Math.sin(theta + objectPosition) - radius_y*1*(Math.sin((radius_y/radius_y + 2) * (theta + objectPosition)));
				break;
			case "epicycloid 3":
				newX = centerX + (radius_x*.4) * Math.cos(theta + objectPosition) - radius_x*1*(Math.cos((radius_x/radius_x + 3) * (theta + objectPosition)));
				newY = centerY + (radius_y*.4) * Math.sin(theta + objectPosition) - radius_y*1*(Math.sin((radius_y/radius_y + 3) * (theta + objectPosition)));
				break;
			case "lissajous":
				newX = centerX + radius_x * (Math.sin(3 * (theta + objectPosition) + xVar1));
				newY = centerY + radius_y * Math.sin(theta + objectPosition);
				xVar1 += .002;
				break;
			case "lemniscate":
				newX = centerX + (radius_x*1.2) * ((Math.cos(theta + objectPosition)/(1 + Math.pow(Math.sin(theta + objectPosition),2))));
				newY = centerY + (radius_y*1.2) * (Math.sin(theta + objectPosition) * (Math.cos(theta + objectPosition)/(1 + Math.pow(Math.sin(theta + objectPosition),2))));
				break;
			case "butterfly":
				newX = centerX + (radius_x*.4) * (Math.cos(theta + objectPosition) * (Math.pow(5,Math.cos(theta+objectPosition)) - 2 * Math.cos(4 * (theta+objectPosition)) - Math.pow(Math.sin((theta+objectPosition)/12),4)));
				newY = centerY + (radius_y*.4) * (Math.sin(theta + objectPosition) * (Math.pow(5,Math.cos(theta+objectPosition)) - 2 * Math.cos(4 * (theta+objectPosition)) - Math.pow(Math.sin((theta+objectPosition)/12),4)));
				break;
			default:
				break;
	
		}
		objects[i].x = newX;
		objects[i].y = newY;
	}
	theta += (orbitSpeed*direction);
	stage.update();
}

Here is a line-by-line breakdown of what is going on in the above code:

  • 2 – 6
    • Declare the global variables for Easel.js, and set the initial environment for the trigonometron code.
  • 9 – 33
    • These are all variables for the trigonometry functions. They are not specific to Easel.js
  • 35:  onload = initEaselDemo
    • This line tell the browser to, once the page is finished loading, run the method called “initEaselDemo()”
  • 37-51 initEaselDemo();
    • This method initializes the global variables.
      • 38 – assign the variable canvas to the HTML element with the ID “myCanvas”
      • 39 – initialize the stage object
      • 40 – tell the stage to listen for mouseover events 36 times a second
      • 41 – allow the stage to register mouse events
      • 43 – initialize the user interface for the trigonometron
      • 44 – initialize the animated circles
      • 47-49 – initialize the Ticker object, which allows frame-based animation
      • 50 – everything is ready to begin
  • 53-134 initInterface();
    • This method creates all of the user control elements, styles them and adds text, and assigns mouse event listeners
      • 54-56 – create and position a container for all of the user control elements
      • 57-100 – iterate through all of the elements in the shapes[] array, and create a button for each
        • 58 – create a container for the button elements
        • 59 – enable mouse events on the button
        • 60 – b.shape is a custom attribute I am adding so that arbitrary values can be assigned to each button
        • 61-65 – create a graphic element, and use it to draw a rectangle
        • 66-68 – create a “shape” display object, and use it to display the graphic element
        • 70-73 – create, position, populate, and style a text object.
        • 75-76 – add the button graphic and the text object to the button container
        • 77-78 – position the button element
        • 79-83 – add onMouseOver functionality to the button – change the cursor to a pointer, change the button color, and update the stage to display the changed button
        • 84-88 – add onMouseOut functionality to the button; essentially identical to the onMouseOver functionality
        • 89-94 – add onClick functionality – switch to different shape for the animation, and show the new animation
        • 96 – add the button to the user control container
        • 101-103 – create and position a container for the elements of the play/pause button
        • 104-108 – create a graphic elements, and use it to draw a rectangle
        • 109-111 – create a “shape” display object, and use it to display the graphic element
        • 112-115 – create, position, populate, and style a text object
        • 116-117 – add the rectangle and the text to the play/pause button element container
        • 118-130 – add mouseover, mouseout, and click functionality to the play/pause button
        • 131 – add the play/pause button to the user control container
        • 132 – add the user control container to the stage
  • 135-139 initObjects();
    • This method counts up to the value of startingObjects and calls addObject once for each iteration
  • 140-154 addObject();
    • This method creates a circle and adds it to the display list
      • 141-146 – create a new circle graphic
      • 147-149 – create and position a display object for the circle
      • 150 – add the circle to the array of circles
      • 151 – update the total number of created circles
      • 152 – adjust the spacing of all the circles in the animation, based on the new number of circles
      • 153 – add the circle to the stage
  • 155-158 removeObjects();
    • this method removes objects from the display list. It is not currently being used
  • 160-164 randomRGB();
    • This method creates a random hexadecimal number between 0 and 255, converts it to a string, and returns it for use in coloring the circles
  • 165-216 tick();
    • This built-in Easel.js method is called based on the Ticker.setFPS() method call on line 47. It iterates through all of the circles in the objects[] array, and updates their positions on the stage, based on the current curve shape
      • 166 – if the trigonometron is paused, do nothing
      • 167- 210 – iterate through the objects, and based on the current curve shape, create new X and Y coordinates for each
      • 211-212 – update the position of each object to match its new coordinates
      • 214 – iterate theta, which is how much the circle should turn on each frame
      • 215 – update the stage to display the changed positions of the objects

So there it is: the entirety of the code for this Easel.js demo, line by line. I left out explanations of the math which calculates the positions of the objects; you can read more on that subject at my Simple Trigonometric Curves tutorial over on Kongregate.com.

Enjoy!

Posted in ProgrammingTagged math comment on HTML5 Canvas Drawing Library Exploration: Easel.js

Sunset, December 31, 2011

2012-01-01 John Winkelman

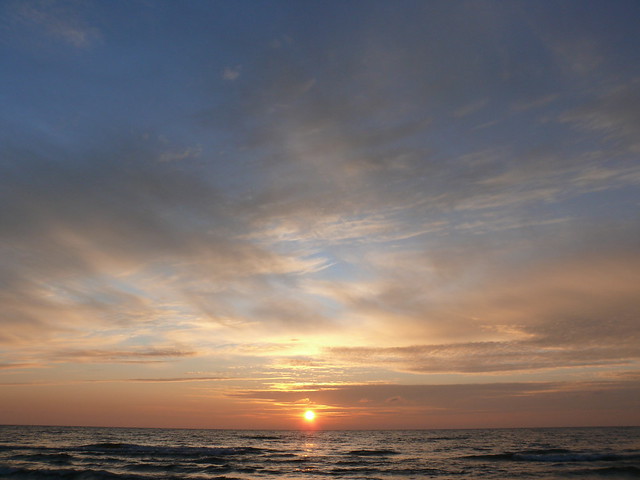
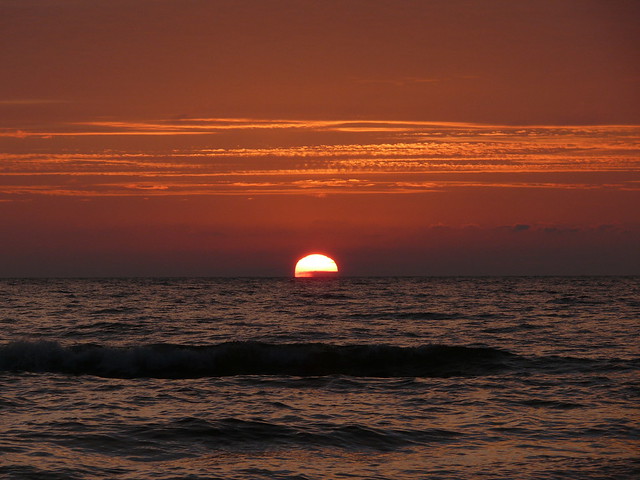
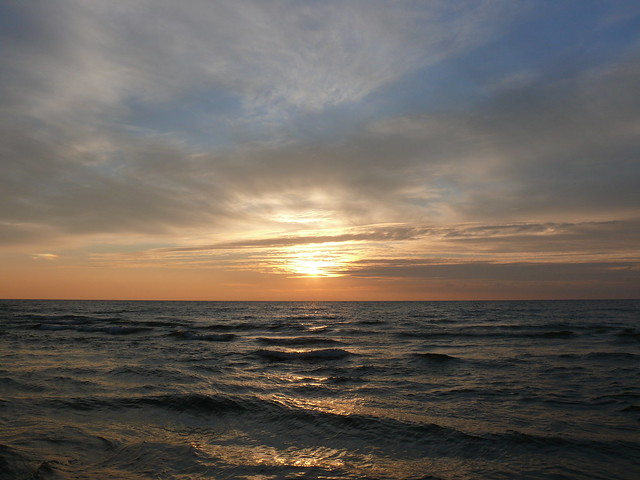
Yesterday afternoon I drove out to Kirk County Park in Ottawa County, on the shore of Lake Michigan, to catch the last sunset of the year. Click any of the photos below to see the rest of the set. Or you can see the entire set as a slide show.

Sunset at Kirk Park

Sunset at Kirk Park

Sunset at Kirk Park

Sunset at Kirk Park

Sunset at Kirk Park

Sunset at Kirk Park

Posted in Photography comment on Sunset, December 31, 2011

Personal website of
John Winkelman

John Winkelman in closeup

Archives

Categories

Posts By Month

January 2012
S M T W T F S
1234567
891011121314
15161718192021
22232425262728
293031  
« Dec   Feb »

Links of Note

Reading, Writing
Tor.com
Locus Online
The Believer
File 770
IWSG

Watching, Listening
Writing Excuses Podcast
Our Opinions Are Correct
The Naropa Poetics Audio Archive

News, Politics, Economics
Naked Capitalism
Crooked Timber

Meta

  • Log in
  • Entries feed
  • Comments feed
  • WordPress.org

© 2025 Ecce Signum

Proudly powered by WordPress | Theme: x-blog by wpthemespace.com