Skip to content

Ecce Signum

Immanentize the Empathy

  • Home
  • About Me
  • Published Works and Literary Matters
  • Indexes
  • Laboratory
  • Notebooks
  • RSS Feed

HTML5 Canvas Drawing Library Exploration: Paper.js

2012-02-09 John Winkelman

This is the fourth in an ongoing series of posts exploring some Javascript drawing libraries. Earlier posts cover Easel, oCanvas, and Raphael.

Paper.js is an interesting library. It is a Javascript port of the Scriptographer tool used in Adobe Illustrator, and much effort has been made to keep the code used in each tool interchangeable. It does a good job of opening the programming door for illustrators looking to create designs which, if created by hand, would be labor-intensive and/or complex to the point of being nearly impossible.

The code for Paper.js is a little more complex than in the previous libraries I have covered. Mouse interactions are a little more take a little more work to set up, and the number of drawing tools is quite large. Paper.js allows the creation of a custom DOM within the canvas element, and that makes it possible to create quite UI-intensive applications.

Click to Launch the demo.

HTML

<!DOCTYPE html>
<html>
	<head>
		<title>Paper.js demo</title>
		<style>
			* {margin:0;padding:0;}
			body {background:#ffffff;margin:0;padding:0;overflow:hidden;}
			#myCanvas {position:absolute;left:0;top:0;width:800px;height:480px;background:#ffffff;}
		</style>
		<script type="text/javascript" src="paper.js"></script>
	</head>
	<body>
		<canvas id="myCanvas" width="800" height="480"></canvas>
		<script type="text/paperscript" canvas="myCanvas">
			//	paperscript code goes here
		</script>
	</body>
</html>

The HTML is mostly identical to that used in the Easel and oCanvas demos, with one exception: Notice the <script/> element in the body. It has a custom type (“text/paperscript”), and a custom attribute (“canvas”), which are used by the Paper.js library to set up the page. Paperscript is simply Javascript with some additional properties and methods. It is possible to use Paper.js with pure Javascript, and the only difference would be some more verbose coding.

Javascript/Paperscript

/*	global variables	*/
var currentShape="circle";
var	isPaused = true;
var	isInitialized = false;
var buttons = [];
var pauseButton;

/*	math and positioning	*/
var shapes = ["circle","tricuspoid","tetracuspoid","epicycloid","epicycloid 2","epicycloid 3","lissajous","lemniscate","butterfly"];
var w = 800;
var h = 480;
var centerX = 240;
var centerY = 240;
var radius_x = 150;
var radius_y = 150;
var theta = 0;
var objects = [];
var numObjects = 0;
var r2d = 180/Math.PI;
var d2r = Math.PI/180;
var orbitSteps = 180;
var orbitSpeed = Math.PI*2/orbitSteps;
var objectInterval;
var objectPosition;
var direction = 1;
var index = 0;
var xVar1 = 0;
var xVar2 = 0;
var xVar3 = 0;
var xVar4 = 0;
var startingObjects = 100;
var newX;
var newY;

initInterface();
initObjects();
onFrame();
isInitialized = true;
function initInterface() {
	var xOff = 650;
	var yOff = 25;
	for(var i=0;i<shapes.length;i++) {
		var bGroup = new Group();
		var btn = new Rectangle(new Point(0,0),new Size(150,20));
		var btnPath = new Path.Rectangle(btn);
		btnPath.fillColor="#ededed";
		btnPath.strokeColor="#808080";
		btnPath.strokeWidth = 1;
		
		btnPath.shapeName = shapes[i];
		
		var txt = new PointText(new Point(75,12));
		txt.content = shapes[i];
		txt.characterStyle= {
			font:"Courier",
			fontSize:10,
			fillColor:"#000000"
		}
		txt.paragraphStyle = {
			justification:"center"
		};
		bGroup.addChild(btnPath);
		bGroup.addChild(txt);
		bGroup.position.x = xOff;
		bGroup.position.y = yOff;
		bGroup.value = shapes[i];
		buttons.push(btnPath);
		yOff += 23;
	}
	yOff += 23;
	
	var pauseButtonGroup = new Group();
	var pauseButtonRect = new Rectangle(new Point(0,0),new Size(150,20));
	pauseButton = new Path.Rectangle(pauseButtonRect);
	pauseButton.fillColor="#ededed";
	pauseButton.strokeColor="#808080";
	btnPath.strokeWidth = 1;
	var pauseButtonText = new PointText(new Point(75,12));
	pauseButtonText.content = "PLAY/PAUSE";
	pauseButtonText.characterStyle= {
		font:"Courier",
		fontSize:10,
		fillColor:"#000000"
	}
	pauseButtonText.paragraphStyle = {
		justification:"center"
	};
	pauseButtonGroup.addChild(pauseButton);
	pauseButtonGroup.addChild(pauseButtonText);
	pauseButtonGroup.position.x = xOff;
	pauseButtonGroup.position.y = yOff;
}

function initObjects() {
	for(var i=0;i<startingObjects;i++) {
		addObject();
	}
}
function addObject() {
	var obj = new Path.Circle(new Point(centerX,centerY),5);
	obj.style={
		fillColor:'#'+randomRGB()+randomRGB()+randomRGB(),
		strokeColor:'#000000'
	};
	objects.push(obj);
	numObjects = objects.length;
	objectInterval = orbitSteps/numObjects;
}
function removeObject() {
	numObjects = objects.length;
	objectInterval = orbitSteps/numObjects;
}

function randomRGB(){
	var s = Math.floor(Math.random()*256).toString(16);
	if(s.length==1) s = "0"+s;
	return s;
}


function onMouseDown(e) {
	for(var i=0;i<buttons.length;i++) {
		if(buttons[i].hitTest(e.point)) {
			currentShape = buttons[i].shapeName;
			isInitialized = false;
			onFrame();
			isInitialized = true;
		}
	}
	if(pauseButton.hitTest(e.point)) {
		isPaused = !isPaused;
	}
}
function onMouseMove(e) {
	for(var i=0;i<buttons.length;i++) {
		if(buttons[i].hitTest(e.point)) {
			buttons[i].fillColor="#ffffff";
		} else {
			buttons[i].fillColor="#ededed";
		}
	}
	if(pauseButton.hitTest(e.point)) {
		pauseButton.fillColor="#ffffff";
	} else {
		pauseButton.fillColor="#ededed";
	}
}

function onFrame(e) {
	if(isPaused==true && isInitialized==true) return;
	for(var i = 0; i < numObjects; i++) {
		objectPosition = orbitSpeed*objectInterval*i;    //    each object is individually updated
		switch(currentShape) {
			case "circle":
				newX = centerX + radius_x * Math.cos(theta + objectPosition);
				newY = centerY + radius_y * Math.sin(theta + objectPosition);
				break;
			case "tricuspoid":
				newX = centerX + (radius_x*.5) * ((2 * Math.cos(theta + objectPosition)) + Math.cos(2 * (theta + objectPosition)));
				newY = centerY + (radius_y*.5) * ((2 * Math.sin(theta + objectPosition)) - Math.sin(2 * (theta + objectPosition)));
				break;
			case "tetracuspoid":
				newX = centerX + radius_x * Math.pow((Math.cos(theta + objectPosition)),3);
				newY = centerY + radius_y * Math.pow((Math.sin(theta + objectPosition)),3);
				break;
			case "epicycloid":
				newX = centerX + (radius_x*.4) * Math.cos(theta + objectPosition) - radius_x*1*(Math.cos((radius_x/radius_x + 1) * (theta + objectPosition)));
				newY = centerY + (radius_y*.4) * Math.sin(theta + objectPosition) - radius_y*1*(Math.sin((radius_y/radius_y + 1) * (theta + objectPosition)));
				break;
			case "epicycloid 2":
				newX = centerX + (radius_x*.4) * Math.cos(theta + objectPosition) - radius_x*1*(Math.cos((radius_x/radius_x + 2) * (theta + objectPosition)));
				newY = centerY + (radius_y*.4) * Math.sin(theta + objectPosition) - radius_y*1*(Math.sin((radius_y/radius_y + 2) * (theta + objectPosition)));
				break;
			case "epicycloid 3":
				newX = centerX + (radius_x*.4) * Math.cos(theta + objectPosition) - radius_x*1*(Math.cos((radius_x/radius_x + 3) * (theta + objectPosition)));
				newY = centerY + (radius_y*.4) * Math.sin(theta + objectPosition) - radius_y*1*(Math.sin((radius_y/radius_y + 3) * (theta + objectPosition)));
				break;
			case "lissajous":
				newX = centerX + radius_x * (Math.sin(3 * (theta + objectPosition) + xVar1));
				newY = centerY + radius_y * Math.sin(theta + objectPosition);
				xVar1 += .002;
				break;
			case "lemniscate":
				newX = centerX + (radius_x*1.2) * ((Math.cos(theta + objectPosition)/(1 + Math.pow(Math.sin(theta + objectPosition),2))));
				newY = centerY + (radius_y*1.2) * (Math.sin(theta + objectPosition) * (Math.cos(theta + objectPosition)/(1 + Math.pow(Math.sin(theta + objectPosition),2))));
				break;
			case "butterfly":
				newX = centerX + (radius_x*.4) * (Math.cos(theta + objectPosition) * (Math.pow(5,Math.cos(theta+objectPosition)) - 2 * Math.cos(4 * (theta+objectPosition)) - Math.pow(Math.sin((theta+objectPosition)/12),4)));
				newY = centerY + (radius_y*.4) * (Math.sin(theta + objectPosition) * (Math.pow(5,Math.cos(theta+objectPosition)) - 2 * Math.cos(4 * (theta+objectPosition)) - Math.pow(Math.sin((theta+objectPosition)/12),4)));
				break;
			default:
				break;
	
		}
		objects[i].position.x = newX;
		objects[i].position.y = newY;
	}
	theta += (orbitSpeed*direction);
}

Here is a line-by-line breakdown of the above Paperscript:

  • 2-6 – initialize some global variables. Note that there is a “pauseButton” variable here. This will be important later.
  • 9-33 – instantiating variables for the trigonometry animations. Nothing here is Paper.js specific.
  • 35 – method call to create the user interface
  • 36 – method call to create the circle graphics used in the animation
  • 37 – display the initial pattern
  • 38 – set the state of the app to “initialized”
  • 39-92 – initInterface() – create the button used to control the animations
    • 40-41 – initialize variables for positioning the UI buttons
    • 42-69 – iterate through the shapes array and create a button for each element therein
      • 43 – create a Group object to hold the elements that make up a button
      • 44 – create a Rectangle object
      • 45 – create a display object to display the Rectangle on the stage
      • 46-48 – style the rectangle
      • 50 – associate the name of the associated animation pattern with this button
      • 52 – create and position a new PointText object for displaying text on the stage.
      • 53 – add text to the PointText object
      • 54-58 – style the text in the text object
      • 59-61 – justify the text in the button. This causes the registration point for the object to be centered. See also the x and y values for the text object created on line 52
      • 62-63 – add the gray rectangle and the text to the Group for this button
      • 64-65 – position this button on the stage
      • 66 – associate the name of the animation shape with this button
      • 67 – add this button to the array of button objects
      • 68 – iterate the y position variable for the buttons
    • 70 – add some space between the preceding buttons and the play/pause button
    • 72-91 – create the play/pause button the same way the as the buttons created on lines 43-67
  • 94-98 – initObjects() – create a number of circle graphics equal to the value of the startingObjects variable
  • 99-108 – addObject() – create a circle graphic and add it to the stage
    • 100 – create a new Circle display object
    • 101-104 – color in the circle and give it an outline
    • 105 – add the circle to the objects array
    • 106 – increase the value of numObjects by one
    • 107 – adjust the spacing of the circle graphics in the animation
  • 109-112 – removeObjects() – not used in this demo
  • 114-118 – randomRGB() – create and return a random hexadecimal value between 0 and 255, inclusive.
  • 121-133 – onMouseDown() – listen for the mouseDown event on the stage
    • 122-129 – iterate through the buttons to see if one of them intersected the click event
      • 123 – if a point on a button has intersected the the coordinates of the mouse click…
      • 124 – set the current animation shape to equal the shape associated with that button
      • 125-127 – update the screen to reflect this change (these lines are only needed if the animation is paused)
    • 130-132 – check to see if the play/pause button intersected the click coordinates, and if so, toggle the isPaused boolean value
  • 134-147 – onMouseMove() – listen for mouse move events on the stage
    • 135-141 – iterate through the buttons to see if one of them is currently being moused over
      • 136-137 – if a button is being moused over, set its fill color to white
      • 138-140 – if not, set its fill color to light gray
    • 142-143 – if the pause button is moused over, set its fill color to white.
    • 144-146 – if not, set its fill color to light gray
  • 149-199 – onFrame(e) – built-in Paper.js method to allow frame-based animations
    • 150 – if the animation is paused, do nothing
    • 151-197 – iterate through the circle graphics and update the position of each
      • 152-194 – for each circle, figure out where it should be based on its position within the list of circle objects, and the value of the currentShape variable
      • 195-196 – update the position of the circle graphic on the stage
    • 198 – update the rotation of the animation for the next frame

So there it is: a trigonometric curves explorer app, done up with Paper.js. It takes a little more work to get things on the screen, and event handling is not as simple as some other libraries, but the level of control over the graphics, and the performance compared to Easel, oCanas, and Raphael, more than make up for the difference.

As with the other posts in this series, the code for the various shapes of the animations comes from the Simple Trigonometric Curves Tutorial over at Kongregate.

Enjoy!


Posted in ProgrammingTagged math, procedural art comment on HTML5 Canvas Drawing Library Exploration: Paper.js

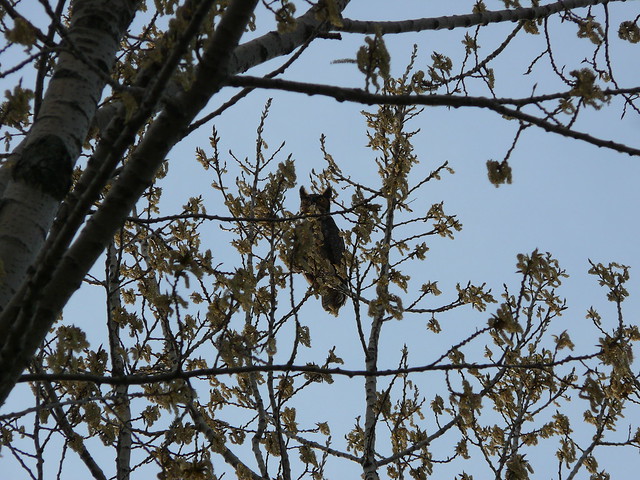
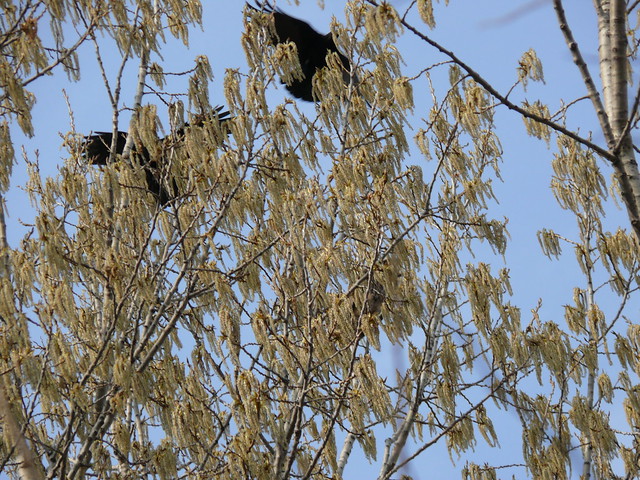
Photos From A Walk Around Seidman Park

2012-02-06 John Winkelman

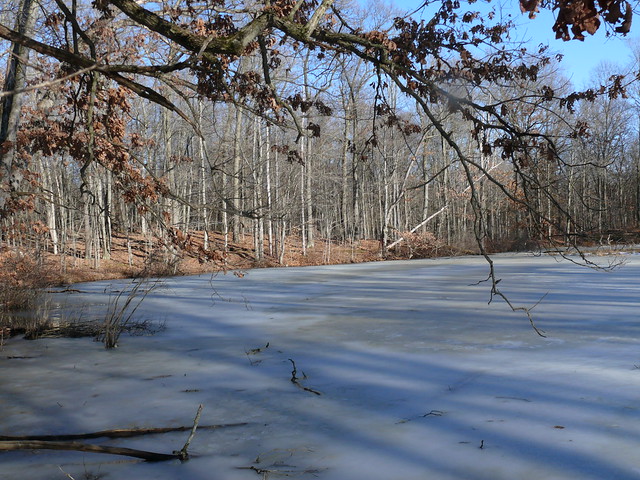
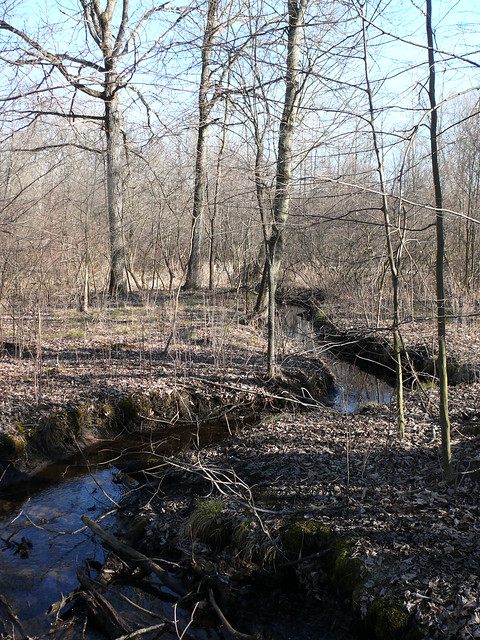
Yesterday was beautiful, and for the first time in WEEKS I had nothing in particular to do, so I spent a good chunk of the afternoon wandering around Seidman Park.

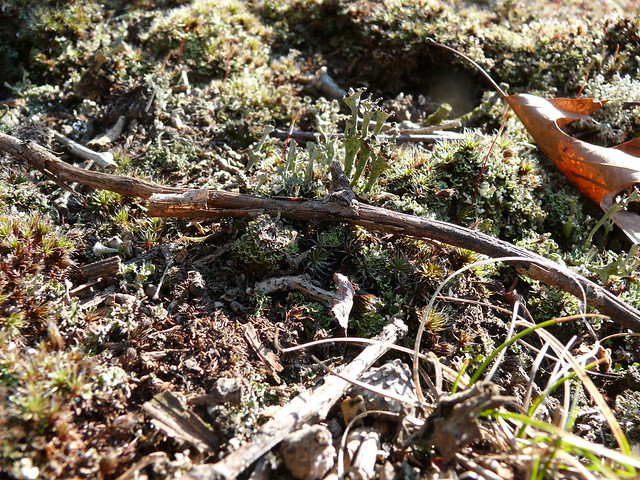
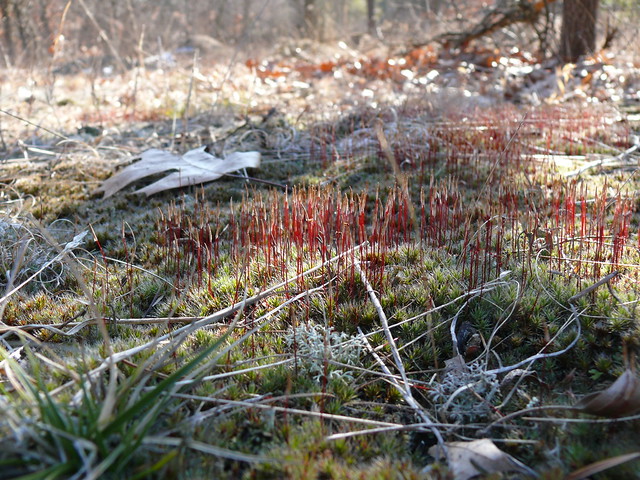
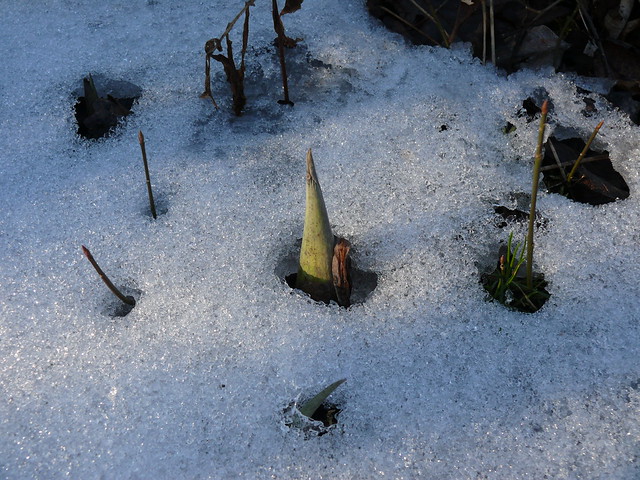
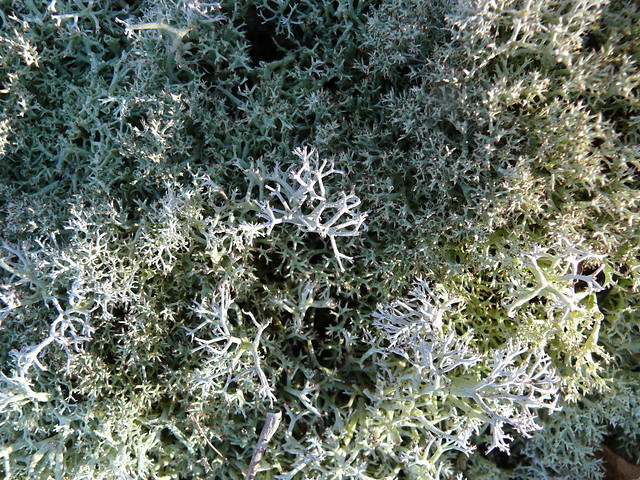
There were many patches of green, growing things, taking full advantage of the unusually mild weather this season.

Photos follow. Each, when clicked, will take you to the full set on Flickr. Or you can skip all that and just start by clicking here.

Moss and lichens

Haircap Moss

Frozen pond

Stream

Skunk Cabbage peeking through the snow

Reindeer Lichen

Posted in Photography comment on Photos From A Walk Around Seidman Park

HTML5 Canvas Drawing Library Exploration: Raphael.js

2012-02-05 John Winkelman

This is the third post in a series of articles exploring Javascript drawing libraries. Others covered at this point include Easel.js and oCanvas.js.

The next library I am going to cover is Raphael.js. This one is a little different. Instead drawing to the canvas element, it makes use of SGV in modern browsers, and VML in old versions of Internet Explorer. Therefore it actually works in browsers all the way back to IE6!

From a programming perspective there isn’t much difference from the other libraries. Using SVG simplifies a lot of things, because SVG display elements are part of the HTML DOM, so the Raphael library doesn’t need to “fake it” with custom objects. On the other hand, because there are more individual elements on the screen at any one time – as opposed to drawings of elements in the canvas tag – performance tends to decline more quickly as visual complexity increases.

Once again, I have created the Trigonometron, trying to keep everything as close as I can to the code structure in the earlier articles.

Click here to launch the demo.

HTML

<!DOCTYPE html>
<html>
	<head>
		<style>
			body {background:#ffffff;margin:0;padding:0;overflow:hidden;}
			#myCanvas {position:absolute;left:0;top:0;width:800px;height:480px;}
		</style>
		<script type="text/javascript" src="raphael-min.js"></script>
	</head>
	<body>
		<div id="myCanvas"></div">
		<script type="text/javascript">
			// code goes here
		</script>
	</body>
</html>

As usual, not a whole lot to see here. Note that, instead of using a canvas element, we are using a div element. This is the element which will contain all of the SVG/VML pieces created by Raphaël.

Javascript

/*	global variables	*/
var canvas,
	currentShape="circle",
	isPaused = true,
	isInitialized = false;

/*	math and positioning	*/
var shapes = ["circle","tricuspoid","tetracuspoid","epicycloid","epicycloid 2","epicycloid 3","lissajous","lemniscate","butterfly"];
var w = 800;
var h = 480;
var centerX = 240;
var centerY = 240;
var radius_x = 150;
var radius_y = 150;
var theta = 0;
var objects = [];
var numObjects = 0;
var r2d = 180/Math.PI;
var d2r = Math.PI/180;
var orbitSteps = 180;
var orbitSpeed = Math.PI*2/orbitSteps;
var objectInterval;
var objectPosition;
var direction = 1;
var index = 0;
var xVar1 = 0;
var xVar2;
var xVar3;
var xVar4;
var startingObjects = 100;
var newX;
var newY;

onload = init;

function init() {
	canvas = new Raphael("myCanvas",800,480);
	initInterface();
	initObjects();
	onEnterFrame();
	isInitialized = true;
	setInterval(onEnterFrame,25);
}
function initInterface() {
	var xOff = 625;
	var yOff = 25;
	for(var i=0;i<shapes.length;i++) {
		var btn = canvas.rect(xOff,yOff,150,20)
			.attr("fill","#ededed")
			.attr("strokeColor","#808080")
			.data("shapeName",shapes[i])
			.mouseover(function(){
				document.getElementById("myCanvas").style.cursor="pointer";
				this.attr("fill","#ffffff");
			})
			.mouseout(function(){
				document.getElementById("myCanvas").style.cursor="auto";
				this.attr("fill","#ededed");
			})
			.click(function(){
				currentShape = this.data("shapeName");
				isInitialized = false;
				onEnterFrame();
				isInitialized = true;
			});
		var txt = canvas.text(xOff+75,yOff+10,shapes[i]).attr({fill:"#000000","font-size":14,"font-family":"Courier","text-anchor":"middle"});
			txt.mouseover(function(){
				document.getElementById("myCanvas").style.cursor="pointer";
				this.graphicBase.attr("fill","#ffffff");
			})
			.mouseout(function(){
				document.getElementById("myCanvas").style.cursor="auto";
				this.graphicBase.attr("fill","#ededed");
			})
			.click(function(){
				currentShape = this.graphicBase.data("shapeName");
				isInitialized = false;
				onEnterFrame();
				isInitialized = true;
			});
		txt.graphicBase = btn;
		yOff += 23;
	}
	yOff += 23;
	var pauseBtn = canvas.rect(xOff,yOff,150,20)
		.attr("fill","#ededed")
		.attr("strokeColor","#808080")
		.mouseover(function(){
			document.getElementById("myCanvas").style.cursor="pointer";
			this.attr("fill","#ffffff");
		})
		.mouseout(function(){
			document.getElementById("myCanvas").style.cursor="auto";
			this.attr("fill","#ededed");
		})
		.click(function(){
			isPaused = !isPaused;
		});
	var txt = canvas.text(xOff+75,yOff+10,"PLAY/PAUSE").attr({fill:"#000000","font-size":14,"font-family":"Courier","text-anchor":"middle"});
	txt.graphicBase = pauseBtn;
	txt.mouseover(function(){
			document.getElementById("myCanvas").style.cursor="pointer";
			this.graphicBase.attr("fill","#ffffff");
		})
		.mouseout(function(){
			document.getElementById("myCanvas").style.cursor="auto";
			this.graphicBase.attr("fill","#ededed");
		})
		.click(function(){
			isPaused = !isPaused;
		});
}

function initObjects() {
	for(var i=0;i<startingObjects;i++) {
		addObject();
	}
}
function addObject() {
	var obj = canvas.circle(centerX,centerY,5);
	obj.attr({
		fill:'#'+randomRGB()+randomRGB()+randomRGB(),
		stroke:'#000000'
	});
	objects.push(obj);
	numObjects = objects.length;
	objectInterval = orbitSteps/numObjects;
}
function removeObject() {
	numObjects = objects.length;
	objectInterval = orbitSteps/numObjects;
}

function randomRGB(){
	var s = Math.floor(Math.random()*256).toString(16);
	if(s.length==1) s = "0"+s;
	return s;
}
function onEnterFrame() {
	if(isPaused==true && isInitialized==true) return;
	for(var i = 0; i < numObjects; i++) {
		objectPosition = orbitSpeed*objectInterval*i;    //    each object is individually updated
		switch(currentShape) {
			case "circle":
				newX = centerX + radius_x * Math.cos(theta + objectPosition);
				newY = centerY + radius_y * Math.sin(theta + objectPosition);
				break;
			case "tricuspoid":
				newX = centerX + (radius_x*.5) * ((2 * Math.cos(theta + objectPosition)) + Math.cos(2 * (theta + objectPosition)));
				newY = centerY + (radius_y*.5) * ((2 * Math.sin(theta + objectPosition)) - Math.sin(2 * (theta + objectPosition)));
				break;
			case "tetracuspoid":
				newX = centerX + radius_x * Math.pow((Math.cos(theta + objectPosition)),3);
				newY = centerY + radius_y * Math.pow((Math.sin(theta + objectPosition)),3);
				break;
			case "epicycloid":
				newX = centerX + (radius_x*.4) * Math.cos(theta + objectPosition) - radius_x*1*(Math.cos((radius_x/radius_x + 1) * (theta + objectPosition)));
				newY = centerY + (radius_y*.4) * Math.sin(theta + objectPosition) - radius_y*1*(Math.sin((radius_y/radius_y + 1) * (theta + objectPosition)));
				break;
			case "epicycloid 2":
				newX = centerX + (radius_x*.4) * Math.cos(theta + objectPosition) - radius_x*1*(Math.cos((radius_x/radius_x + 2) * (theta + objectPosition)));
				newY = centerY + (radius_y*.4) * Math.sin(theta + objectPosition) - radius_y*1*(Math.sin((radius_y/radius_y + 2) * (theta + objectPosition)));
				break;
			case "epicycloid 3":
				newX = centerX + (radius_x*.4) * Math.cos(theta + objectPosition) - radius_x*1*(Math.cos((radius_x/radius_x + 3) * (theta + objectPosition)));
				newY = centerY + (radius_y*.4) * Math.sin(theta + objectPosition) - radius_y*1*(Math.sin((radius_y/radius_y + 3) * (theta + objectPosition)));
				break;
			case "lissajous":
				newX = centerX + radius_x * (Math.sin(3 * (theta + objectPosition) + xVar1));
				newY = centerY + radius_y * Math.sin(theta + objectPosition);
				xVar1 += .002;
				break;
			case "lemniscate":
				newX = centerX + (radius_x*1.2) * ((Math.cos(theta + objectPosition)/(1 + Math.pow(Math.sin(theta + objectPosition),2))));
				newY = centerY + (radius_y*1.2) * (Math.sin(theta + objectPosition) * (Math.cos(theta + objectPosition)/(1 + Math.pow(Math.sin(theta + objectPosition),2))));
				break;
			case "butterfly":
				newX = centerX + (radius_x*.4) * (Math.cos(theta + objectPosition) * (Math.pow(5,Math.cos(theta+objectPosition)) - 2 * Math.cos(4 * (theta+objectPosition)) - Math.pow(Math.sin((theta+objectPosition)/12),4)));
				newY = centerY + (radius_y*.4) * (Math.sin(theta + objectPosition) * (Math.pow(5,Math.cos(theta+objectPosition)) - 2 * Math.cos(4 * (theta+objectPosition)) - Math.pow(Math.sin((theta+objectPosition)/12),4)));
				break;
			default:
				break;
	
		}
		objects[i].attr('cx',newX);
		objects[i].attr('cy',newY);
	}
	theta += (orbitSpeed*direction);
}

Here is line-by-line breakdown of the above code.

  • 2-5 – initialize global variables
  • 8-32 – initialize variables for the animation. Not Raphaël-specific
  • 34 – set the init() function to fire when the page finishes loading
  • 36-43 – init()
    • 37 – create a new Raphaël object
    • 38 – create the user interface
    • 39 – initialize the animation code
    • 40 – display the initial pattern on the screen
    • 42 – start the animation
  • 44-112 – initInterface()
    • 45-46 initialize the variables used to position the UI buttons
    • 47-83 – create one UI button for each animation pattern
      • 48-51 – create and style a gray rectangle
      • 52-55 – add the mouseover functionality
      • 56-59 – add the mouseout functionality
      • 60-65 – add the onclick functionality
      • 66 – create a text object
      • 67-70 – add mouseover functionality to the text object. This is necessary because, as a DOM element, the text object will block mouse events from reaching the gray square beneath it. Elements cannot be nested in Raphaël, so they must instead be positioned and stacked.
      • 71-74 – add mouseout functionality to the text object
      • 75-80 – add onclick functionality to the text object
      • 81- associate the button object underneath each text object with that text object
      • 82 – update the vertical positioning variable for the next button
      • 84 – add some space between the pattern buttons and the play/pause button
      • 85-111 – create the play/pause button, using the same methods as the pattern buttons above
  • 114-118 – initObjects()
    • 115-116 – create a number of circles on the screen equal to the value in the startingObjects variable
  • 119-128 – addObject()
    • 120 – create a new “circle” graphic object
    • 121-124 – style the color and outline stroke of the circle
    • 125 – add the circle to the objects array
    • 126-127 – update the variable which controls spacing between the circles on the screen
  • 129-132 – removeObject()  – not used in this demonstration
    • 130-131 – update the variable which controls spacing between the circles on the screen
  • 134-138 – function randomRGB() – create and return a random hexadecimal number between 0 and 255, inclusive.
  • 139-189 – onEnterFrame()
    • This is the function which animates the circles based on the current animation pattern, which is held in the variable “currentShape”
      • 140 – if the animation is currently paused, do nothing
      • 141 – begin iterating through each object in the animation
      • 142 – get the position of the circle graphic in the sequence of graphic objects
      • 143-184 – based on the variable “currentShape”, determine the new position of the circle graphic within the animation
      • 185-186 – update the position of the circle graphic on the screen
      • 188 – increment the rotation of the entire animation

So there you have it: A simple web app writting in Javascript, using the Raphaël graphics library. Be sure, when using this library, to remember that you are working with vector graphics and DOM elements, not custom Javascript objects drawn onto the <canvas/> element.

As in the other articles in this series, the math for the animations comes from my Simple Trigonometric Curves Tutorial over at Kongregate.

If you come up with something interesting using the Raphaël library, be sure to post a link to it in the comments!

Posted in ProgrammingTagged math, procedural art comment on HTML5 Canvas Drawing Library Exploration: Raphael.js

HTML5 Canvas Drawing Library Exploration: oCanvas.js

2012-01-29 John Winkelman

This is part 2 of an ongoing series exploring the different Javascript/canvas element drawing libraries which are currently in use.

oCanvas.js is another small-footprint, easy to use Javascript library. In use it is similar to Easel.js (see my review of easel.js here), but the syntax is a little simpler. Where Easel feels more like Actionscript, oCanvas feels more like jQuery. This makes sense, since Easel was written to appeal to Flash developers.

Other than syntax, oCanvas and Easel seem to be interchangeable. Easel might have more fine-tuned control over drawing, but not enough to make a significant difference in any but the most complex web applications.

oCanvas is a lot of fun to play with, The syntax is easy to pick up; the documentation is well structured, and anyone familiar with jQuery should be able to extrapolate from the examples on the oCanvas site and have something up and running in a few minutes.

The only real downside to oCanvas is that no-one appears to be using it. Almost all of the articles I found which talk about oCanvas are of the “here are a dozen new Javascript drawing libraries” type, and they only link back to the oCanvas page. No examples out in the wild. No demos or source code other than that created by the oCanvas team. I think that is a shame. oCanvas deserves more attention than that.

So here is a simple demonstration of oCanvas, along with source code and commentary. Enjoy!

Click to Launch the demo.

HTML

<!DOCTYPE html>
<html>
	<head>
		<title>oCanvas.js demo</title>
		<style>
			* {margin:0;padding:0;}
			body {background:#ffffff;margin:0;padding:0;overflow:hidden;}
			#myCanvas {position:absolute;left:0;top:0;width:800px;height:480px;background:#ffffff;}
		</style>
		<script type="text/javascript" src="ocanvas.js"></script>
		<script type="text/javascript" src="ocanvas-test-code.js"></script>
	</head>
	<body>
		<canvas id="myCanvas" width="800" height="480"></canvas>
	</body>
</html>

Nothing too exciting in the HTML. Be sure to include the width and height attributes in the canvas element so that the graphics therein are not distorted.

Javascript

/*	global variables	*/
var canvas,
	currentShape="circle",
	isPaused = true,
	isInitialized = false;

/*	math and positioning	*/
var shapes = ["circle","tricuspoid","tetracuspoid","epicycloid","epicycloid 2","epicycloid 3","lissajous","lemniscate","butterfly"];
var w = 800;
var h = 480;
var centerX = 240;
var centerY = 240;
var radius_x = 150;
var radius_y = 150;
var theta = 0;
var objects = [];
var numObjects = 0;
var r2d = 180/Math.PI;
var d2r = Math.PI/180;
var orbitSteps = 180;
var orbitSpeed = Math.PI*2/orbitSteps;
var objectInterval;
var objectPosition;
var direction = 1;
var index = 0;
var xVar1 = 0;
var xVar2;
var xVar3;
var xVar4;
var startingObjects = 100;
var newX;
var newY;

onload = init;

function init() {
	canvas = oCanvas.create({
		canvas: "#myCanvas",
		background: "#ffffff"
	});
	
	initInterface();
	initObjects();
	
	
	onEnterFrame();
	isInitialized = true;
	canvas.setLoop(onEnterFrame).start();
}

function initInterface() {
	var xOff = 625;
	var yOff = 25;
	for(var i=0;i<shapes.length;i++) {
		var b = canvas.display.rectangle({
			x:xOff,
			y:yOff,
			width:150,
			height:20,
			fill:'#ededed',
			stroke:'1px outside #808080',
			shapeName:shapes[i]
		});
		var txt = canvas.display.text({
			x:75,
			y:4,
			align:'center',
			font:'12px courier,monospace',
			text:shapes[i],
			fill:'#000000'
		});
		b.addChild(txt);
		b.bind('mouseenter',function(){
			document.getElementById("myCanvas").style.cursor="pointer";
			this.fill = '#ffffff';
		});
		b.bind('mouseleave',function(){
			document.getElementById("myCanvas").style.cursor="auto";
			this.fill = '#ededed';
		});
		b.bind('click',function(){
			currentShape = this.shapeName;
			isInitialized = false;
			onEnterFrame();
			isInitialized = true;
		});
		yOff += 23;
		canvas.addChild(b);
	}
	yOff += 23;
	var pauseButton = canvas.display.rectangle({
		x:xOff,
		y:yOff,
		width:150,
		height:20,
		fill:'#ededed',
		stroke:'1px outside #808080'
	});
	var pauseButtonText = canvas.display.text({
		x:75,
		y:4,
		align:'center',
		font:'12px courier,monospace',
		text:"PLAY/PAUSE",
		fill:'#000000'
	});
	pauseButton.addChild(pauseButtonText);
	pauseButton.bind('mouseenter',function(){
		document.getElementById("myCanvas").style.cursor="pointer";
		this.fill = '#ffffff';
	});
	pauseButton.bind('mouseleave',function(){
		document.getElementById("myCanvas").style.cursor="auto";
		this.fill = '#ededed';
	});
	pauseButton.bind('click',function() {
		isPaused = !isPaused;
	});
	canvas.addChild(pauseButton);

}
function initObjects() {
	for(var i=0;i<startingObjects;i++) {
		addObject();
	}
}
function addObject() {
var obj = canvas.display.ellipse({
		x:centerX,
		y:centerY,
		radius_x:5,
		radius_y:5,
		stroke:"1px #000000",
		fill:"#"+randomRGB()+randomRGB()+randomRGB()
	});
	objects.push(obj);
	numObjects = objects.length;
	objectInterval = orbitSteps/numObjects;
	canvas.addChild(obj);
}
function removeObject() {
	numObjects = objects.length;
	objectInterval = orbitSteps/numObjects;
}

function randomRGB(){
	var s = Math.floor(Math.random()*256).toString(16);
	if(s.length==1) s = "0"+s;
	return s;
}
function onEnterFrame() {
	if(isPaused==true && isInitialized==true) return;
	for(var i = 0; i < numObjects; i++) {
		objectPosition = orbitSpeed*objectInterval*i;    //    each object is individually updated
		switch(currentShape) {
			case "circle":
				newX = centerX + radius_x * Math.cos(theta + objectPosition);
				newY = centerY + radius_y * Math.sin(theta + objectPosition);
				break;
			case "tricuspoid":
				newX = centerX + (radius_x*.5) * ((2 * Math.cos(theta + objectPosition)) + Math.cos(2 * (theta + objectPosition)));
				newY = centerY + (radius_y*.5) * ((2 * Math.sin(theta + objectPosition)) - Math.sin(2 * (theta + objectPosition)));
				break;
			case "tetracuspoid":
				newX = centerX + radius_x * Math.pow((Math.cos(theta + objectPosition)),3);
				newY = centerY + radius_y * Math.pow((Math.sin(theta + objectPosition)),3);
				break;
			case "epicycloid":
				newX = centerX + (radius_x*.4) * Math.cos(theta + objectPosition) - radius_x*1*(Math.cos((radius_x/radius_x + 1) * (theta + objectPosition)));
				newY = centerY + (radius_y*.4) * Math.sin(theta + objectPosition) - radius_y*1*(Math.sin((radius_y/radius_y + 1) * (theta + objectPosition)));
				break;
			case "epicycloid 2":
				newX = centerX + (radius_x*.4) * Math.cos(theta + objectPosition) - radius_x*1*(Math.cos((radius_x/radius_x + 2) * (theta + objectPosition)));
				newY = centerY + (radius_y*.4) * Math.sin(theta + objectPosition) - radius_y*1*(Math.sin((radius_y/radius_y + 2) * (theta + objectPosition)));
				break;
			case "epicycloid 3":
				newX = centerX + (radius_x*.4) * Math.cos(theta + objectPosition) - radius_x*1*(Math.cos((radius_x/radius_x + 3) * (theta + objectPosition)));
				newY = centerY + (radius_y*.4) * Math.sin(theta + objectPosition) - radius_y*1*(Math.sin((radius_y/radius_y + 3) * (theta + objectPosition)));
				break;
			case "lissajous":
				newX = centerX + radius_x * (Math.sin(3 * (theta + objectPosition) + xVar1));
				newY = centerY + radius_y * Math.sin(theta + objectPosition);
				xVar1 += .002;
				break;
			case "lemniscate":
				newX = centerX + (radius_x*1.2) * ((Math.cos(theta + objectPosition)/(1 + Math.pow(Math.sin(theta + objectPosition),2))));
				newY = centerY + (radius_y*1.2) * (Math.sin(theta + objectPosition) * (Math.cos(theta + objectPosition)/(1 + Math.pow(Math.sin(theta + objectPosition),2))));
				break;
			case "butterfly":
				newX = centerX + (radius_x*.4) * (Math.cos(theta + objectPosition) * (Math.pow(5,Math.cos(theta+objectPosition)) - 2 * Math.cos(4 * (theta+objectPosition)) - Math.pow(Math.sin((theta+objectPosition)/12),4)));
				newY = centerY + (radius_y*.4) * (Math.sin(theta + objectPosition) * (Math.pow(5,Math.cos(theta+objectPosition)) - 2 * Math.cos(4 * (theta+objectPosition)) - Math.pow(Math.sin((theta+objectPosition)/12),4)));
				break;
			default:
				break;
	
		}
		objects[i].x = newX;
		objects[i].y = newY;
	}
	theta += (orbitSpeed*direction);
}

Here is a line-by-line breakdown of the preceding Javascript:

  • 2-5
    • initializing global variables
  • 8-32
    • initializing variables for the demo. This is mostly all for the animation. Nothing here that is oCanvas-specific.
  • 34
    • This tells the browser to fire the init() function when the page finishes loading.
  • 36-49 – function init()
    • Fired when the page loads
      • 37-40 initialize the global canvas variable, and associate it with the HTML canvas element which has the id of “myCanvcas”
      • 42-43 – create the user interface, and initialize the objects for animation
      • 46 – call the animation function once in order to display the objects
      • 47 – set the global initialization state
      • 48 – begin the animation. By default the animation is paused
  • 51-121 – initInterface()
    • Create the user interface for the demo
      • 52-53 – set the base position for the UI buttons
      • 54-89 – create the UI buttons
        • 55-63 – create and style a rectangle graphic, and assign the “shapeName” property, which references one of the animation sequences
        • 64-71 – create and style a text block, which displays the name of one of the animation sequences
        • 72 – add the text block as a child of the rectangle graphic
        • 73-76 – add the mouseover behavior for the button
        • 77-80 – and the mouseout behavior for the button
        • 81-86 – add the onclick behavior to the button. Updates the “currentShape”  variable to equal the value of the button’s “shapeName” property
        • 87 – update the base Y position for the buttons
        • 88 – add the button object to the canvas object. This is how objects are made visible in oCanvas
      • 90 – update the Y variable to add some space between the preceding buttons and the play/pause button
      • 91-98 – create and style a rectangle graphic for the play/pause button
      • 99-106 – create a text block for the play/pause button
      • 107 – add the text block as a child of the play/pause button graphic
      • 108-111 – add mouseover functionality to the play/pause button
      • 112-115 – add mouseout functionality to the play/pause button
      • 116-118 – add onclick functionality to the play/pause button. A click will toggle the paused state of the demo
      • 119 – add the play/pause button to the canvas
  • 122-126 – initObjects()
    • This method counts up to the value of startingObjects and calls addObject once for each iteration
  • 127-140 – addObject()
    • this function creates a circle graphic, styles it, updates some of the animation variables, and adds the new object to the canvas
      • 128-135 – create and style a circle graphic
      • 136 – add the circle to the array of circles
      • 137 – update the numObjects variable to equal the number of elements in the objects array
      • 138 – update the spacing between circles, based on the number of circles in the animation
      • 139 – add the new circle graphic to the canvas
  • 141-144 – removeObject()
    • remove a circle from the animation. Not used in this demo
  • 146-150 – randomRGB()
    • create a random hexadecimal number between 0 and 255, convert it to a string, and return it for use in coloring the circle graphics.
  • 151-201 – onEnterFrame()
    • This is the function which animates the circles based on the current animation pattern, which is held in the variable “currentShape”
      • 152 – if the animation is currently paused, do nothing
      • 153 – begin iterating through each object in the animation
      • 154 – get the position of the circle in the sequence of circles
      • 155-196 – based on the variable “currentShape”, determine the new position of the circle within the animation
      • 197-198 – update the position of the circle within the canvas
      • 200 – increment the rotation of the entire animation

And there you have it. If you compare the code for this animation with the code in the Easel.js post, you will see that they are quite similar. The syntax for oCanvas is a little simpler, but it still allows the same control over style and position.

As in the other articles in this series, the math for the animations comes from my Simple Trigonometric Curves Tutorial over at Kongregate.

I hope that oCanvas gets some more attention from web developers. It is a worthy project.


Posted in ProgrammingTagged math, procedural art comment on HTML5 Canvas Drawing Library Exploration: oCanvas.js

Serving Up Static HTML Pages in Drupal Gardens Websites

2012-01-27 John Winkelman

As the learning curve for out-of-the-box content management systems flattens out, hand-coded HTML pages are becoming something of a rare bird. With services like Facebook, WordPress, Tumblr, and a hundred others, there simply isn’t as much call for hand-coded, one-off web sites. However, they still have their place – either in sites like this one, where I like posting experiments in a variety of languages, or for more professional organizations, where HTML wireframes or interactive comps would be more useful than static Photoshop documents and Powerpoint presentations.

Therefore, I took it upon myself to figure out how to serve up individual, custom HTML pages from within the confines of this site, which is a custom installation of Drupal 7, hosted at Drupal Gardens, and served up as cloud-based Software-as-a Service.

It is quite simple, actually. First, you need to have a static HTML page, which either contains within it everything you need, or has links to the appropriate outside assets. These could be images, external stylesheets, Flash movies, or the like. So if you have something like this:

<!DOCTYPE html>
<html>
	<head>
		<title>Static HTML Page Demo</title>
		<style>
			* {margin:0;padding:0;}
			body {background:#ffffff;}
			p {font:12px/18px arial,sans-serif;color:#333333;}
		</style>
		<script type="text/javascript" src="/sites/mysite.drupalgardens.com/files/my-groovy-code.js"></script>
	</head>
	<body>
		<p>Welcome to my wonderful website</p>
	</body>
</html>

…in a file called, say, “static-html-page-example.html”. Then, in order to put it in a place where it is accessible to the world, you can do the following:

  1. Log into your Drupal Gardens website
  2. Click on “Configuration”
  3. In the “Media” box of the configuration page, click on “Media browser settings”
  4. In the “Allowed file extensions” text area, add html to the end. Be sure to use a space to separate it from the other extensions.
  5. Click “Save configuration”.
  6. In the upper bar of the content area, click on “content”
  7. When the main content page opens, click on the “MEDIA” tab on the right side of the page
  8. In the new screen, click “+ Add File”
  9. drag your HTML file onto the “add file” area (or browse to it and click “add”), then click “Start Upload”
  10. You will now see your file appear in the list of media assets for your library. Click on it.
  11. You should now see a page, the content of which is a link to your static HTML page. If you click that link, it will take you to that page. Click here to see how it works.

See? That was easy! Once you have your assets created, all you need to do is organize and upload.

You will only need to performs steps 1-5 once. After you add a file extension, it is there for good.

Since Drupal Gardens has constraints over and above a normal Drupal install, some allowances must be made. Here are a few things to watch out for:

  • Every external asset in your static  page – images, videos, Flash files, style sheets, etc., must also be uploaded to the Drupal Gardens media directory. The same process you used to serve up your static HTML file also applies for these assets. You shouldn’t need to add file extensions for images or videos, but you might for Flash (swf), and you will for Javascript (js) and style sheets (css).
  • Since every asset is served from the files directory, you need to make sure you acount for this when you create the HTML page. The path to all of you assets will be
    “/sites/mysite.drupalgardens.com/files/myAsset.css”. Be sure to add the leading slash.

    • Alternately, you could add a <base href=”/sites/mysite.drupalgardens.com/files/”/> element in the <head/> element of your static HTML file (information here). This would cut down on the amount of modification you would need to do when moving the static site from your computer to Drupal Gardens. You could simple add the tag to all of your HTML files right before you upload everything.
  • Again, since all uploaded media, files, assets, etc. for your entire Drupal Gardens site are stored in a single directory, it is important to name all of your assets in such a way that it is easy to determine which asset goes with which project. I have found that using a prefix is a great way to keep things organized. Here are a couple of examples:
    • “20120126-index.html”
    • “20120126-image-0.jpg”
    • “20120126-stylesheet.css”
    • “clientname-index.html”
    • “date-client-file-1.html”

There! The best of both worlds: A managed Drupal environment, and the ability to upload and serve custom, static HTML pages if and as the need arises.

Posted in Programming comment on Serving Up Static HTML Pages in Drupal Gardens Websites

HTML5 Canvas Drawing Library Exploration: Easel.js

2012-01-26 John Winkelman

I’ve spent the last few weeks, at home and at work, exploring some of the capabilities of HTML 5. The most exciting one for me, at the moment, is the Canvas element, which allows dynamic creation and updating of graphics within a web page. This type of functionality is useful for creating games, data visualizations, custom user interfaces, and most anything else that traditionally is considered to be in the realm of Adobe Flash.

In exploring the various tutorials I discovered that many people have put a lot of time into building Javascript libraries which add functionality to the canvas tag, making it more Flash-like. A side effect of this is that these libraries usually – though not always – simplify the coding process dramatically. What could take many hours and many hundreds of lines of custom code can now be accomplished in a short amount of time and relatively little code.

So starting with this post, and going on for the next few weeks, I will be posting examples of these libraries in use, along with source code and commentary. A note here: The examples will only work in browsers which support the canvas tag – Internet Explorer 9+, Firefox, Safari or Chrome on Windows, and Safari and Chrome on Macs, and Chrome and Konqueror on Linux. These examples should also work on most newer mobile devices using their default web browsers. However, things might be a little slow and clunky.

For this post, I am working with Easel.js (current version 0.4), a canvas drawing library created by Flash guru Grant Skinner.

When I learn a new language or technology, I consider the first sign of success to be when I manage to get a bunch of objects to spin in a circle. The canvas tag libraries are no different. For this, and the next several, I have re-created the Trigonometron (which seems to have not made the transition to the new site…), one of my proudest moments as a Flash developer.

Click to launch the demo.

Detailed breakdown of the code follows:

HTML

<!DOCTYPE html>
<html>
	<head>
		<title>Easel.js demo</title>
		<style>
			* {margin:0;padding:0;}
			body {background:#ffffff;margin:0;padding:0;overflow:hidden;}
			#myCanvas {position:absolute;left:0;top:0;width:800px;height:480px;background:#ffffff;}
		</style>
		<script type="text/javascript" src="easel.js"></script>
		<script type="text/javascript" src="easel-demo-code.js"></script>
	</head>
	<body>
		<canvas id="myCanvas" width="800" height="480"></canvas>
	</body>
</html>

Nothing particularly amazing about this HTML. Note that I used the width and height attributes in the canvas tag, rather than simply relying on the style sheet. This is a quirk of Easel.js – if the width and height attributes are not set, then it will visibly skew and stretch the graphics inside the canvas tag. Hopefully this will be addressed in an upcoming release.

Javascript

/*	global variables	*/
var canvas,
	stage,
	currentShape="circle",
	isPaused = true,
	isInitialized = false;

/*	math and positioning	*/
var shapes = ["circle","tricuspoid","tetracuspoid","epicycloid","epicycloid 2","epicycloid 3","lissajous","lemniscate","butterfly"];
var w = 800;
var h = 480;
var centerX = 240;
var centerY = 240;
var radius_x = 150;
var radius_y = 150;
var theta = 0;
var objects = [];
var numObjects = 0;
var r2d = 180/Math.PI;
var d2r = Math.PI/180;
var orbitSteps = 180;
var orbitSpeed = Math.PI*2/orbitSteps;
var objectInterval;// = orbitSteps/numObjects;
var objectPosition;
var direction = 1;
var index = 0;
var xVar1 = 0;
var xVar2;
var xVar3;
var xVar4;
var startingObjects = 100;
var newX;
var newY;

onload = initEaselDemo;

function initEaselDemo() {
	canvas = document.getElementById("myCanvas");
	stage = new Stage(canvas);
	stage.enableMouseOver(36)
	stage.mouseEnabled = true;
	
	initInterface();
	initObjects();
	
	//	set 
	Ticker.setFPS(36);
	Ticker.addListener(window);
	tick();
	isInitialized = true;
}

function initInterface() {
	var interfaceBase = new Container();
	interfaceBase.x = 630;
	interfaceBase.y = 20;
	for(var i=0;i<shapes.length;i++) {
		var b = new Container();
		b.mouseEnabled = true;
		b.shape = shapes[i];
		var g = new Graphics();
		g.setStrokeStyle(1)
			.beginStroke('#808080')
			.beginFill('#ededed')
			.rect(0,0,150,20);
		var s = new Shape(g);
		s.x = 0;
		s.y = 0;
		
		var t = new Text(shapes[i],"12px Courier","#000000");
		t.textAlign="center";
		t.x = 75;
		t.y = 14;
		
		b.addChild(s);
		b.addChild(t);
		b.x = 0;
		b.y = i*23;
		b.onMouseOver = function(e) {
			document.getElementById("myCanvas").style.cursor="pointer";
			e.target.getChildAt(0).graphics.beginFill("#ffffff").rect(0,0,150,20);
			if(isPaused) stage.update();
		}
		b.onMouseOut = function(e) {
			document.getElementById("myCanvas").style.cursor="auto";
			e.target.getChildAt(0).graphics.beginFill("#ededed").rect(0,0,150,20);
			if(isPaused) stage.update();
		}
		b.onClick = function(e) {
			currentShape = e.target.shape;
			isInitialized = false;
			tick();
			isInitialized = true;
		}
		
		interfaceBase.addChild(b);


	}
	var ppb = new Container();
	ppb.x = 0;
	ppb.y = (shapes.length*23+10);
	var ppg = new Graphics()
		.setStrokeStyle(1)
		.beginStroke('#808080')
		.beginFill('#ededed')
		.rect(0,0,150,20);
	var pps = new Shape(ppg);
	pps.x = 0;
	pps.y = 0;
	var ppt = new Text("PLAY/PAUSE","12px Arial,sans-serif","#000000");
	ppt.textAlign = "center";
	ppt.x = 75;
	ppt.y = 14;
	ppb.addChild(pps);
	ppb.addChild(ppt);
	ppb.onMouseOver = function(e){
		document.getElementById("myCanvas").style.cursor="pointer";
		e.target.getChildAt(0).graphics.beginFill("#ffffff").rect(0,0,150,20);
		stage.update();
	}
	ppb.onMouseOut = function(e){
		document.getElementById("myCanvas").style.cursor="auto";
		e.target.getChildAt(0).graphics.beginFill("#ededed").rect(0,0,150,20);
		stage.update();
	}
	ppb.onClick = function() {
		isPaused = !isPaused;
	}
	interfaceBase.addChild(ppb);
	
	stage.addChild(interfaceBase);
}
function initObjects() {
	for(var i=0;i<startingObjects;i++) {
		addObject();
	}
}
function addObject() {
	var g = new Graphics()
		.setStrokeStyle(1)
		.beginStroke("#000000")
		.beginFill("#"+randomRGB()+randomRGB()+randomRGB())
		.drawCircle(0,0,5)
		.endFill();
	var s = new Shape(g);
	s.x = centerX;
	s.y = centerY;
	objects.push(s);
	numObjects = objects.length;
	objectInterval = orbitSteps/numObjects;
	stage.addChild(s);
}
function removeObject() {
	numObjects = objects.length;
	objectInterval = orbitSteps/numObjects;
}

function randomRGB(){
	var s = Math.floor(Math.random()*256).toString(16);
	if(s.length==1) s = "0"+s;
	return s;
}
function tick() {
	if(isPaused==true && isInitialized==true) return;
	for(var i = 0; i < numObjects; i++) {
		objectPosition = orbitSpeed*objectInterval*i;    //    each object is individually updated
		switch(currentShape) {
			case "circle":
				newX = centerX + radius_x * Math.cos(theta + objectPosition);
				newY = centerY + radius_y * Math.sin(theta + objectPosition);
				break;
			case "tricuspoid":
				newX = centerX + (radius_x*.5) * ((2 * Math.cos(theta + objectPosition)) + Math.cos(2 * (theta + objectPosition)));
				newY = centerY + (radius_y*.5) * ((2 * Math.sin(theta + objectPosition)) - Math.sin(2 * (theta + objectPosition)));
				break;
			case "tetracuspoid":
				newX = centerX + radius_x * Math.pow((Math.cos(theta + objectPosition)),3);
				newY = centerY + radius_y * Math.pow((Math.sin(theta + objectPosition)),3);
				break;
			case "epicycloid":
				newX = centerX + (radius_x*.4) * Math.cos(theta + objectPosition) - radius_x*1*(Math.cos((radius_x/radius_x + 1) * (theta + objectPosition)));
				newY = centerY + (radius_y*.4) * Math.sin(theta + objectPosition) - radius_y*1*(Math.sin((radius_y/radius_y + 1) * (theta + objectPosition)));
				break;
			case "epicycloid 2":
				newX = centerX + (radius_x*.4) * Math.cos(theta + objectPosition) - radius_x*1*(Math.cos((radius_x/radius_x + 2) * (theta + objectPosition)));
				newY = centerY + (radius_y*.4) * Math.sin(theta + objectPosition) - radius_y*1*(Math.sin((radius_y/radius_y + 2) * (theta + objectPosition)));
				break;
			case "epicycloid 3":
				newX = centerX + (radius_x*.4) * Math.cos(theta + objectPosition) - radius_x*1*(Math.cos((radius_x/radius_x + 3) * (theta + objectPosition)));
				newY = centerY + (radius_y*.4) * Math.sin(theta + objectPosition) - radius_y*1*(Math.sin((radius_y/radius_y + 3) * (theta + objectPosition)));
				break;
			case "lissajous":
				newX = centerX + radius_x * (Math.sin(3 * (theta + objectPosition) + xVar1));
				newY = centerY + radius_y * Math.sin(theta + objectPosition);
				xVar1 += .002;
				break;
			case "lemniscate":
				newX = centerX + (radius_x*1.2) * ((Math.cos(theta + objectPosition)/(1 + Math.pow(Math.sin(theta + objectPosition),2))));
				newY = centerY + (radius_y*1.2) * (Math.sin(theta + objectPosition) * (Math.cos(theta + objectPosition)/(1 + Math.pow(Math.sin(theta + objectPosition),2))));
				break;
			case "butterfly":
				newX = centerX + (radius_x*.4) * (Math.cos(theta + objectPosition) * (Math.pow(5,Math.cos(theta+objectPosition)) - 2 * Math.cos(4 * (theta+objectPosition)) - Math.pow(Math.sin((theta+objectPosition)/12),4)));
				newY = centerY + (radius_y*.4) * (Math.sin(theta + objectPosition) * (Math.pow(5,Math.cos(theta+objectPosition)) - 2 * Math.cos(4 * (theta+objectPosition)) - Math.pow(Math.sin((theta+objectPosition)/12),4)));
				break;
			default:
				break;
	
		}
		objects[i].x = newX;
		objects[i].y = newY;
	}
	theta += (orbitSpeed*direction);
	stage.update();
}

Here is a line-by-line breakdown of what is going on in the above code:

  • 2 – 6
    • Declare the global variables for Easel.js, and set the initial environment for the trigonometron code.
  • 9 – 33
    • These are all variables for the trigonometry functions. They are not specific to Easel.js
  • 35:  onload = initEaselDemo
    • This line tell the browser to, once the page is finished loading, run the method called “initEaselDemo()”
  • 37-51 initEaselDemo();
    • This method initializes the global variables.
      • 38 – assign the variable canvas to the HTML element with the ID “myCanvas”
      • 39 – initialize the stage object
      • 40 – tell the stage to listen for mouseover events 36 times a second
      • 41 – allow the stage to register mouse events
      • 43 – initialize the user interface for the trigonometron
      • 44 – initialize the animated circles
      • 47-49 – initialize the Ticker object, which allows frame-based animation
      • 50 – everything is ready to begin
  • 53-134 initInterface();
    • This method creates all of the user control elements, styles them and adds text, and assigns mouse event listeners
      • 54-56 – create and position a container for all of the user control elements
      • 57-100 – iterate through all of the elements in the shapes[] array, and create a button for each
        • 58 – create a container for the button elements
        • 59 – enable mouse events on the button
        • 60 – b.shape is a custom attribute I am adding so that arbitrary values can be assigned to each button
        • 61-65 – create a graphic element, and use it to draw a rectangle
        • 66-68 – create a “shape” display object, and use it to display the graphic element
        • 70-73 – create, position, populate, and style a text object.
        • 75-76 – add the button graphic and the text object to the button container
        • 77-78 – position the button element
        • 79-83 – add onMouseOver functionality to the button – change the cursor to a pointer, change the button color, and update the stage to display the changed button
        • 84-88 – add onMouseOut functionality to the button; essentially identical to the onMouseOver functionality
        • 89-94 – add onClick functionality – switch to different shape for the animation, and show the new animation
        • 96 – add the button to the user control container
        • 101-103 – create and position a container for the elements of the play/pause button
        • 104-108 – create a graphic elements, and use it to draw a rectangle
        • 109-111 – create a “shape” display object, and use it to display the graphic element
        • 112-115 – create, position, populate, and style a text object
        • 116-117 – add the rectangle and the text to the play/pause button element container
        • 118-130 – add mouseover, mouseout, and click functionality to the play/pause button
        • 131 – add the play/pause button to the user control container
        • 132 – add the user control container to the stage
  • 135-139 initObjects();
    • This method counts up to the value of startingObjects and calls addObject once for each iteration
  • 140-154 addObject();
    • This method creates a circle and adds it to the display list
      • 141-146 – create a new circle graphic
      • 147-149 – create and position a display object for the circle
      • 150 – add the circle to the array of circles
      • 151 – update the total number of created circles
      • 152 – adjust the spacing of all the circles in the animation, based on the new number of circles
      • 153 – add the circle to the stage
  • 155-158 removeObjects();
    • this method removes objects from the display list. It is not currently being used
  • 160-164 randomRGB();
    • This method creates a random hexadecimal number between 0 and 255, converts it to a string, and returns it for use in coloring the circles
  • 165-216 tick();
    • This built-in Easel.js method is called based on the Ticker.setFPS() method call on line 47. It iterates through all of the circles in the objects[] array, and updates their positions on the stage, based on the current curve shape
      • 166 – if the trigonometron is paused, do nothing
      • 167- 210 – iterate through the objects, and based on the current curve shape, create new X and Y coordinates for each
      • 211-212 – update the position of each object to match its new coordinates
      • 214 – iterate theta, which is how much the circle should turn on each frame
      • 215 – update the stage to display the changed positions of the objects

So there it is: the entirety of the code for this Easel.js demo, line by line. I left out explanations of the math which calculates the positions of the objects; you can read more on that subject at my Simple Trigonometric Curves tutorial over on Kongregate.com.

Enjoy!

Posted in ProgrammingTagged math comment on HTML5 Canvas Drawing Library Exploration: Easel.js

Sunset, December 31, 2011

2012-01-01 John Winkelman

Yesterday afternoon I drove out to Kirk County Park in Ottawa County, on the shore of Lake Michigan, to catch the last sunset of the year. Click any of the photos below to see the rest of the set. Or you can see the entire set as a slide show.

Sunset at Kirk Park

Sunset at Kirk Park

Sunset at Kirk Park

Sunset at Kirk Park

Sunset at Kirk Park

Sunset at Kirk Park

Posted in Photography comment on Sunset, December 31, 2011

Pickerel Lake, 26 December, 2011

2011-12-31 John Winkelman

Pickerel Lake

Photos taken the day after Christmas at Pickerel Lake in West Michigan. Click the photo above to see the rest of the set on Flickr.

Posted in Photography comment on Pickerel Lake, 26 December, 2011

On Walking to Work

2011-12-30 John Winkelman

For most of my career as a developer – say, nine of the past twelve years – I have lived within two miles of my workplace. Cybernet, BBK/PeopleDesign and now, Cynergy. On heavy traffic days it is actually faster for me to walk to work than to drive. Even on good days, driving saves me, at best, ten minutes in each direction. When weather permits, I ride my bike.

But I like best to walk. Especially in the morning, when the city is still waking up. The best days are in the cold parts of the year when the sun is just hitting the tops of the highest trees and buildings. Those are also the days when I walk home after dark.

Biking is more efficient, certainly, but – weather aside – I trust the drivers on the road less than during brighter parts of the year. There are fewer bikers from November through March, so drivers are even less aware of them (us) than usual. I can then choose to slalom quickly on the streets, slowly on the sidewalk, or just walk.

Currently I am exactly a mile and a half from work. The walk takes a little less than half an hour each way. Call it a total of fifty minutes a day, for three miles. Fifteen miles a week, and slightly over four hours. Sometimes I will stop for coffee at MadCap or the Grand Central Market. On the way home, I will often swing by the library. Sometimes I will stop back at the Grand Central Market for a sandwich.

The smell of the city changes from block to block and from month to month. In the summer, the city smells green and steamy. In the winter, earth and smoke. Currently, in the morning the scent trail goes something like this: leaves, earth, bread baking, pavement, car exhaust, bus fumes, cigarette smoke, concrete, pancakes, coffee, river, and occasionally hops from one of the local breweries. Each day is unique as a fingerprint.

This is the last work day of the year. Since i started this job on August 22, I have driven to work exactly twice. Call it 18 weeks. Or 17, when holidays are removed. So 17 weeks, five work-days a week, three miles a day. 255 miles. Or in my Subaru, a full tank of gas. Extrapolate it out and it is around 750 miles a year of using alternate transportation.

And the best part is that I feel more connected with Grand Rapids than I have in years. Working in front of a computer for 8+ hours a day, even in an office full of good people, is kind of alienating. Walking brings me back to earth.

Posted in Life comment on On Walking to Work

Accessing Views From Flash in Drupal Gardens

2011-12-19 John Winkelman

Wow, life can be whacky.

So I am pretty sold on Drupal Gardens as a base for most of my future development projects. However, there are still a couple of useful pieces missing, that are out-of-the-box available on a full Drupal install. Specifically, the Services module. Services allow alternate means of accessing data stored in the Drupal database. So if I want to, say, use Drupal as a content management system for a Flash game, I can just pull information in as and when I need it, by referencing a URL and passing the appropriate parameters.

Drupal Gardens doesn’t allow that yet. Well, technically they do, but only in very specific ways, none of which are ideal for using Drupal as a straightforward CMS. Having said that, apparently adding this functionality is something they are looking into.

But enough carping! It is possible to use DG as a CMS for a Flash (or AJAX, or Silverlight, etc) application, provided you only need to pull content out of the database, not put it back in. It just takes a bit of a work-around to get everything up and running.

Note: The rest of this post assumes a familiarity with Actionscript, Drupal Views and RSS feeds. If not, take a few minutes to read up on them.

The Views module allows the contents of a view to be published as a Page, as a Block, or as an RSS feed. Say I am making a role-playing game, and I need to populate the world therein with wildlife. To keep things simple, each critter has the following information points:

  • name
  • description
  • terrain (where the creature might be encountered)
  • associated element ( from the classic 5, for combat purposes)

So after entering data for several animals, you would end up with a table which looks something like this:

Name Description Terrain element
squirrel cute, fluffy, voracious forest wood
camel cute, fluffy, spits a lot desert water
walrus truly, nature’s most majestic animal plains earth

…at least, that’s how it looks in the database. To get it into Flash (in Drupal Gardens, at present) requires a little more work. But not a lot more work.

Pulling the RSS feed of a view is quite simple. Just create a “feed” version of an existing view, and set up a URL path for it, and voila! You have a  feed of the contents of a view.

However, note that the actual contents of a view, when delivered in an RSS feed, are all packed into the <description> tag of the view, and include all of the HTML which would normally be rendered in the page. It looks something like this:


  http://ecceludum.drupalgardens.com/feeds/monsters/terrain/desert
    
    en
          http://ecceludum.drupalgardens.com/content/camel
    
&lt;div class=&quot;field field-name-body field-type-text-with-summary field-label-hidden&quot;&gt;
&lt;div class=&quot;field-items&quot;&gt;
&lt;div class=&quot;field-item even&quot; property=&quot;content:encoded&quot;&gt; 
&lt;p&gt;camel text&lt;/p&gt; 
&lt;/div&gt;
&lt;/div&gt;
&lt;/div&gt;
&lt;div class=&quot;field field-name-field-monster-element field-type-taxonomy-term-reference field-label-above&quot;&gt;
&lt;div class=&quot;field-label&quot;&gt;element:&nbsp;
&lt;/div&gt;
&lt;div class=&quot;field-items&quot;&gt;
&lt;div class=&quot;field-item even&quot;&gt;
&lt;a href=&quot;/elements/water&quot; typeof=&quot;skos:Concept&quot; property=&quot;rdfs:label skos:prefLabel&quot;&gt;Water
&lt;/a&gt;
&lt;/div&gt;
&lt;/div&gt;
&lt;/div&gt;
&lt;div class=&quot;field field-name-field-monster-terrain field-type-taxonomy-term-reference field-label-above&quot;&gt;
&lt;div class=&quot;field-label&quot;&gt;terrain:&amp;nbsp;
&lt;/div&gt;
&lt;div class=&quot;field-items&quot;&gt;
&lt;div class=&quot;field-item even&quot;&gt;
&lt;a href=&quot;/terrain/desert&quot; typeof=&quot;skos:Concept&quot; property=&quot;rdfs:label skos:prefLabel&quot;&gt;desert
&lt;/a&gt;
&lt;/div&gt;
&lt;/div&gt;
&lt;/div&gt;

     Thu, 15 Dec 2011 18:22:47 +0000
 John Winkelman
 71 at http://ecceludum.drupalgardens.com
 http://ecceludum.drupalgardens.com/content/camel#comments


All well and good, except boy, are the contents of the DESCRIPTION tag ugly. That is because the  angle brackets, ampersands, quote marks and non-breaking spaces have  been re-written as plain text character entities. In a sense, they have been rendered as a picture of source code, rather than source code. There is a simple fix for this: When Flash pulls in an RSS feed (or any other XML-based document) it pulls this content in as plain text. It is not structured as XML until after it is loaded into the Flash movie. This means that the string can be parsed internally, and all of the character entities turned into their respective text elements. E.g. each instance of “&gt;” can be replaced with a “>”. The simplest way might be the following line of code:

var newString = oldString.split("&lt;").join("<").split("&gt;").join(">").split("&quot;").join("\"").split("&nbsp;").join(" ");
var myXML = new XML(newString);

If that is run on the preceding big ugly bit of RSS feed, then the contents of the DESCRIPTION tags would suddenly look like this:

<div class="field field-name-body field-type-text-with-summary field-label-hidden">
<div class="field-items">
<div class="field-item even" property="content:encoded"> 
<p>camel text</p> 
</div>
</div>
</div>
<div class="field field-name-field-monster-element field-type-taxonomy-term-reference field-label-above">
<div class="field-label">element: 
</div>
<div class="field-items">
<div class="field-item even">
<a href="/elements/water" typeof="skos:Concept" property="rdfs:label skos:prefLabel">Water
</a>
</div>
</div>
</div>
<div class="field field-name-field-monster-terrain field-type-taxonomy-term-reference field-label-above">
<div class="field-label">terrain:&nbsp;
</div>
<div class="field-items">
<div class="field-item even">
<a href="/terrain/desert" typeof="skos:Concept" property="rdfs:label skos:prefLabel">desert
</a>
</div>
</div>
</div>

Now the contents of the DESCRIPTION element of the RSS feed XML are structured and can be parsed using the Flash XML tools. In this instance, you would look for the contents of the elements div.field-name-field-monster-element a, div.field-name-field-monster-terrain a, and div.field-name-body p.

You will note that there are a lot of extra DIV tags, and many of them have huge long class names and/ir IDs. This is not a problem for two reasons: first, the data is well-structured, and second, it is consistent. Unless there are changes to the structure of the View in Drupal Gardens – e.g. changing the “terrain” data field to be called “territory” instead – every time the data is pulled from this RSS feed for this View, it will have exactly the same structure. Having five records or ten thousand won’t change things.

So there it is: An overview of how to access Views information from a Flash movie, via RSS, in Drupal Gardens.

Posted in Programming comment on Accessing Views From Flash in Drupal Gardens

Posts navigation

Older posts
Newer posts

Personal website of
John Winkelman

John Winkelman in closeup

Archives

Categories

Posts By Month

August 2025
S M T W T F S
 12
3456789
10111213141516
17181920212223
24252627282930
31  
« Jul    

Links of Note

Reading, Writing
Tor.com
Locus Online
The Believer
File 770
IWSG

Watching, Listening
Writing Excuses Podcast
Our Opinions Are Correct
The Naropa Poetics Audio Archive

News, Politics, Economics
Naked Capitalism
Crooked Timber

Meta

  • Log in
  • Entries feed
  • Comments feed
  • WordPress.org

© 2025 Ecce Signum

Proudly powered by WordPress | Theme: x-blog by wpthemespace.com